Team Dashboard
The team dashboard gives a global overview of information most relevant to the team.
Prerequisites
The Team dashboard uses the Team's Grafana instance to get it's information from. Make sure Grafana is enabled for the team. To enable Grafana:
- Go to
Settings - Managed monitoring
- Enable Grafana
Dashboard elements
The dashboard has 5 elements
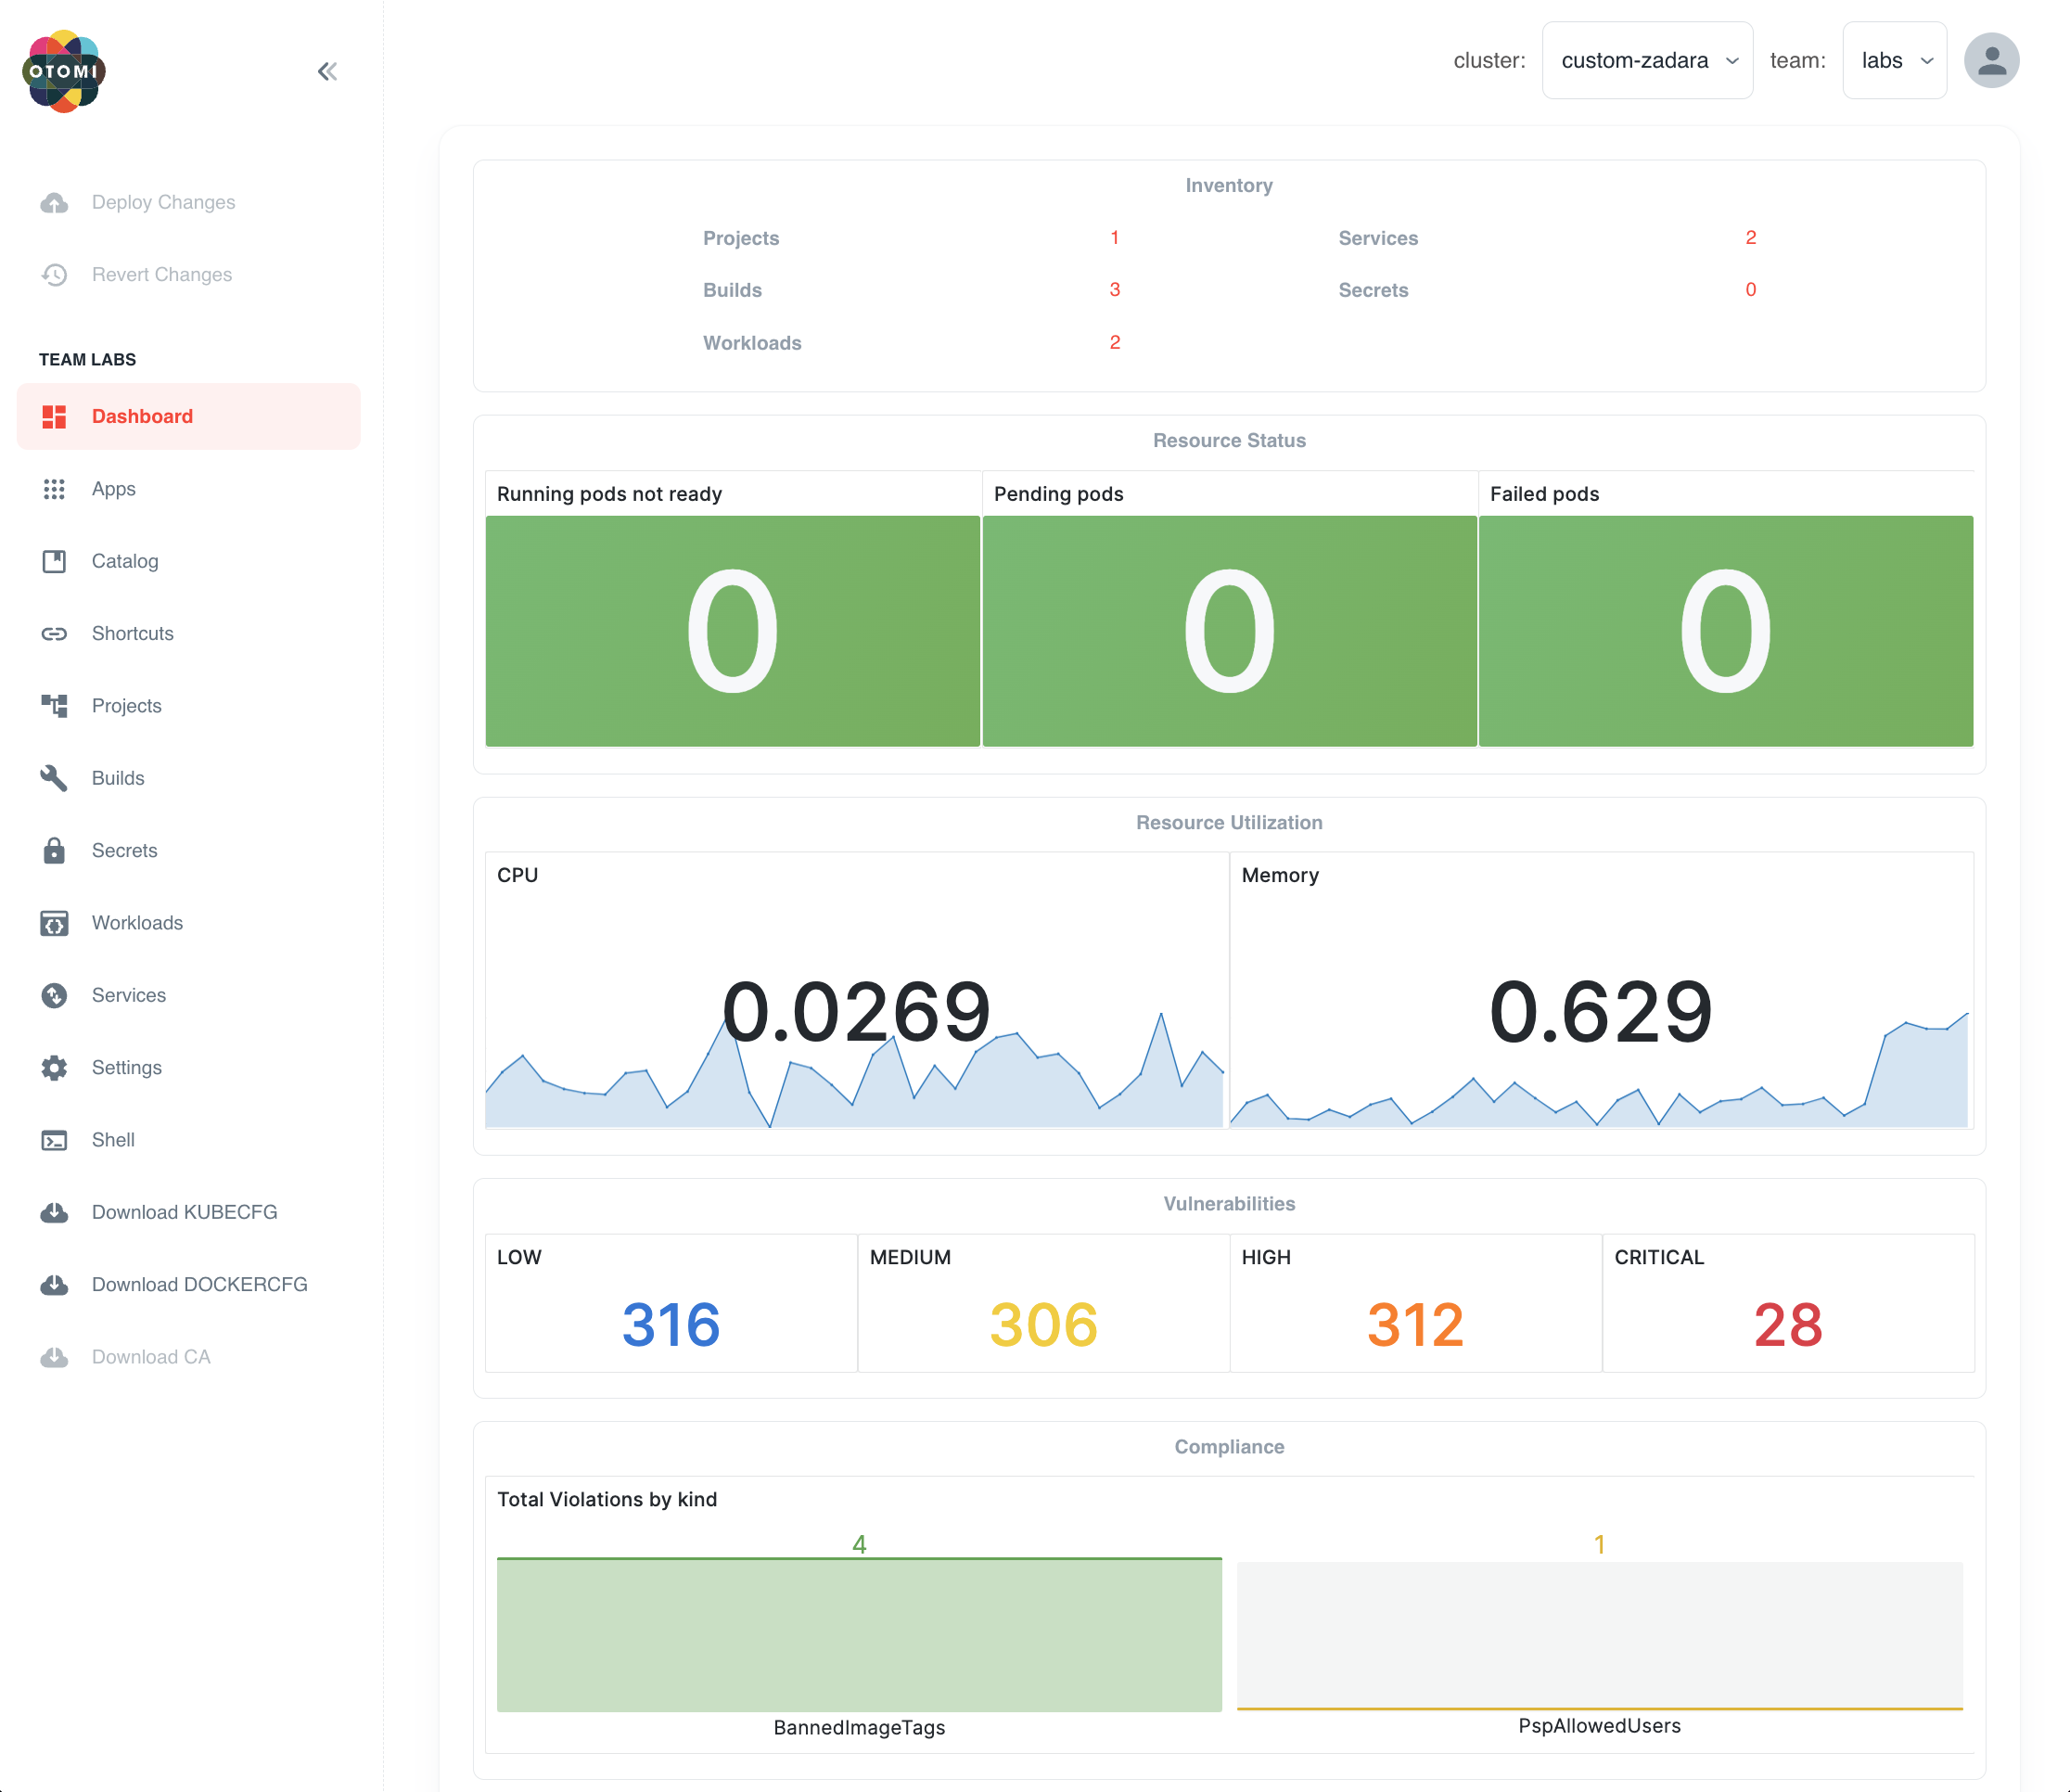
Inventory
The inventory shows the Otomi resources within the team. Click on an inventory item to go directly to the full list.
Resource Status
The Resource Status panels show if there are any issues with Pods deployed by the team.
Resource Utilization
The Resource Utilization panels show the total amount of CPU and Memory consumed by the team.
Vulnerabilities
The Vulnerabilities panels show the total amount of LOW, MEDIUM, HIGH and CRITICAL vulnerabilities in running containers deployed by the Team.
Compliance
The Compliance panel shows the total amount of policy violations in workloads deployed by the Team.