Check policy compliance
info
Prerequisite: For this lab, Gatekeeper needs to be activated.
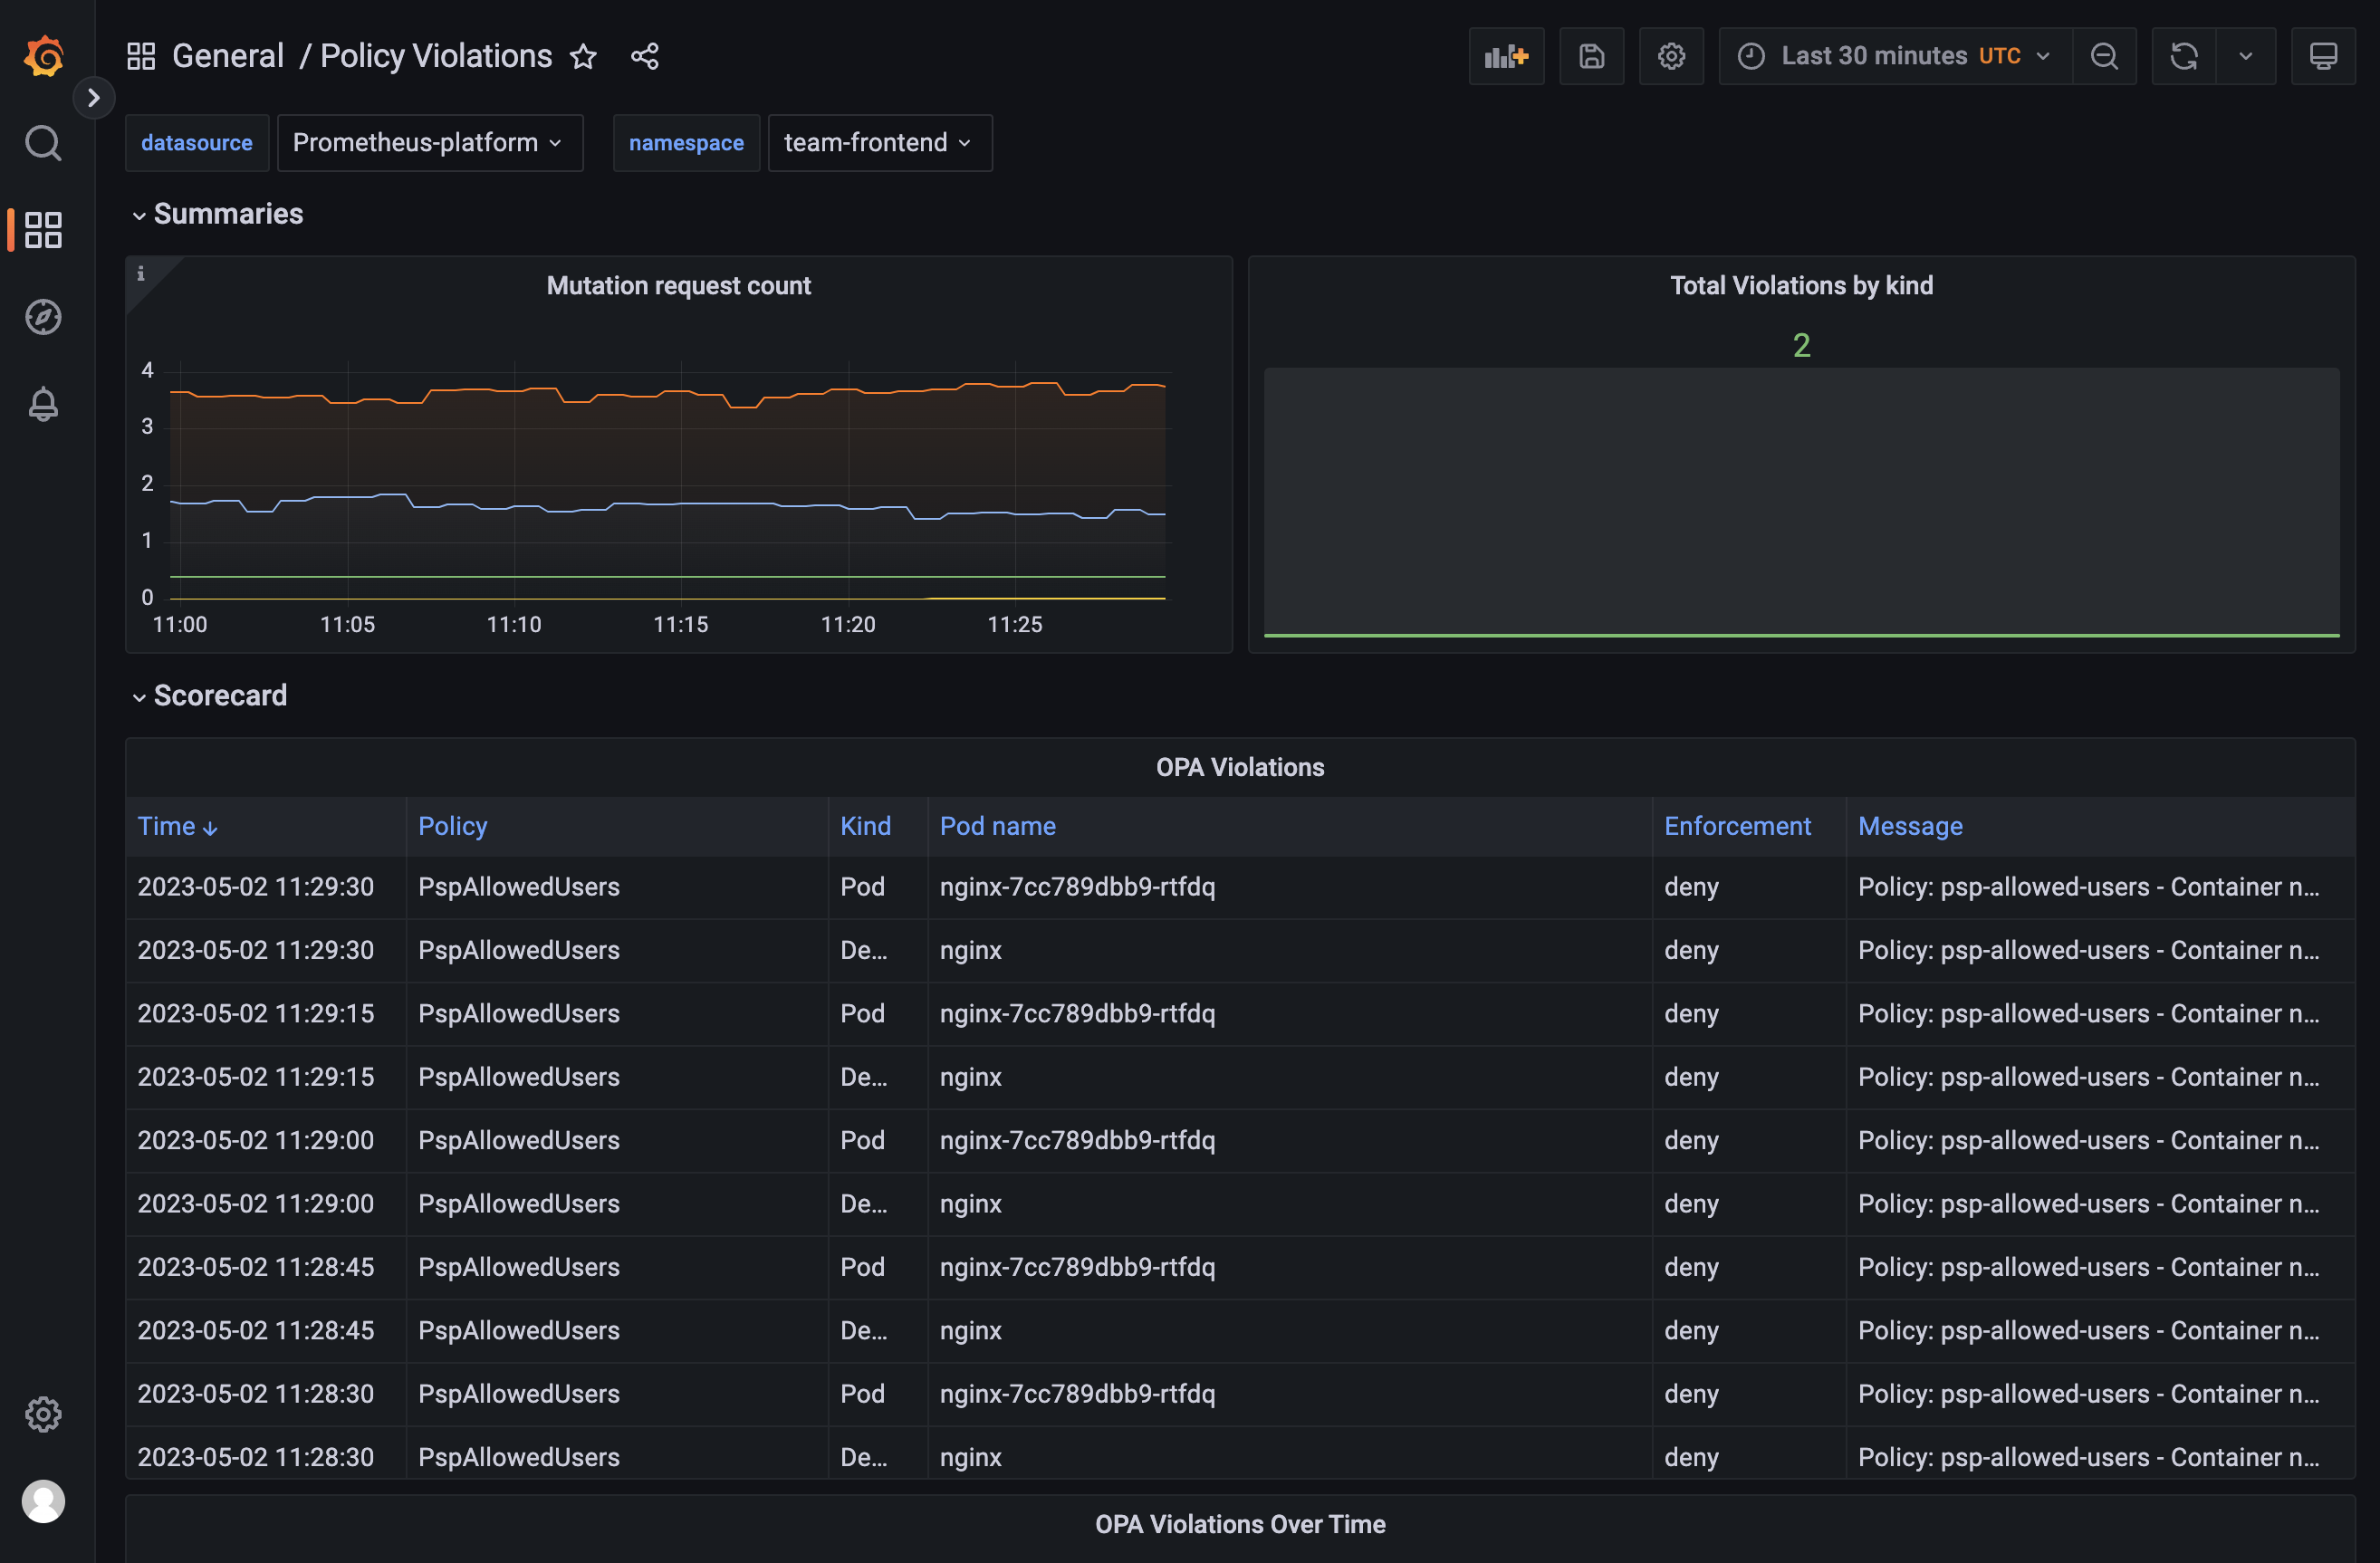
When the platform administrator has enabled Gatekeeper and configured policies, you might like to check and see if your workloads are policy compliant. When the administrator has enabled Gatekeeper on the platform level, each team will automatically get access to a Policy Violations dashboard in Grafana.
View policy violations
- Open the Grafana app
- Click on
Dashboards/Browse - In the list of dashboards you will see a dashboard called
Policy Violations. Click on it - Now you will see the following dashboard, showing all detected policy violations within your team workloads