Create custom dashboards
In the lab Using custom metrics we created a Workload with a ServiceMonitor so the Team's Prometheus can scrape our custom metrics. In this lab we are going to create a custom Grafana dashboard and add the dashboard to a Configmap so the Team's Grafana will automatically load the dashboard.
Create a dashboard in Grafana
-
In the left menu, click on
Appsand openGrafana -
Go to the Grafana dashboard homepage
-
In the top right click on
Newand thenNew Dashboard -
Click
+ Add visualization -
In the
Querytab selectPrometheus (default) -
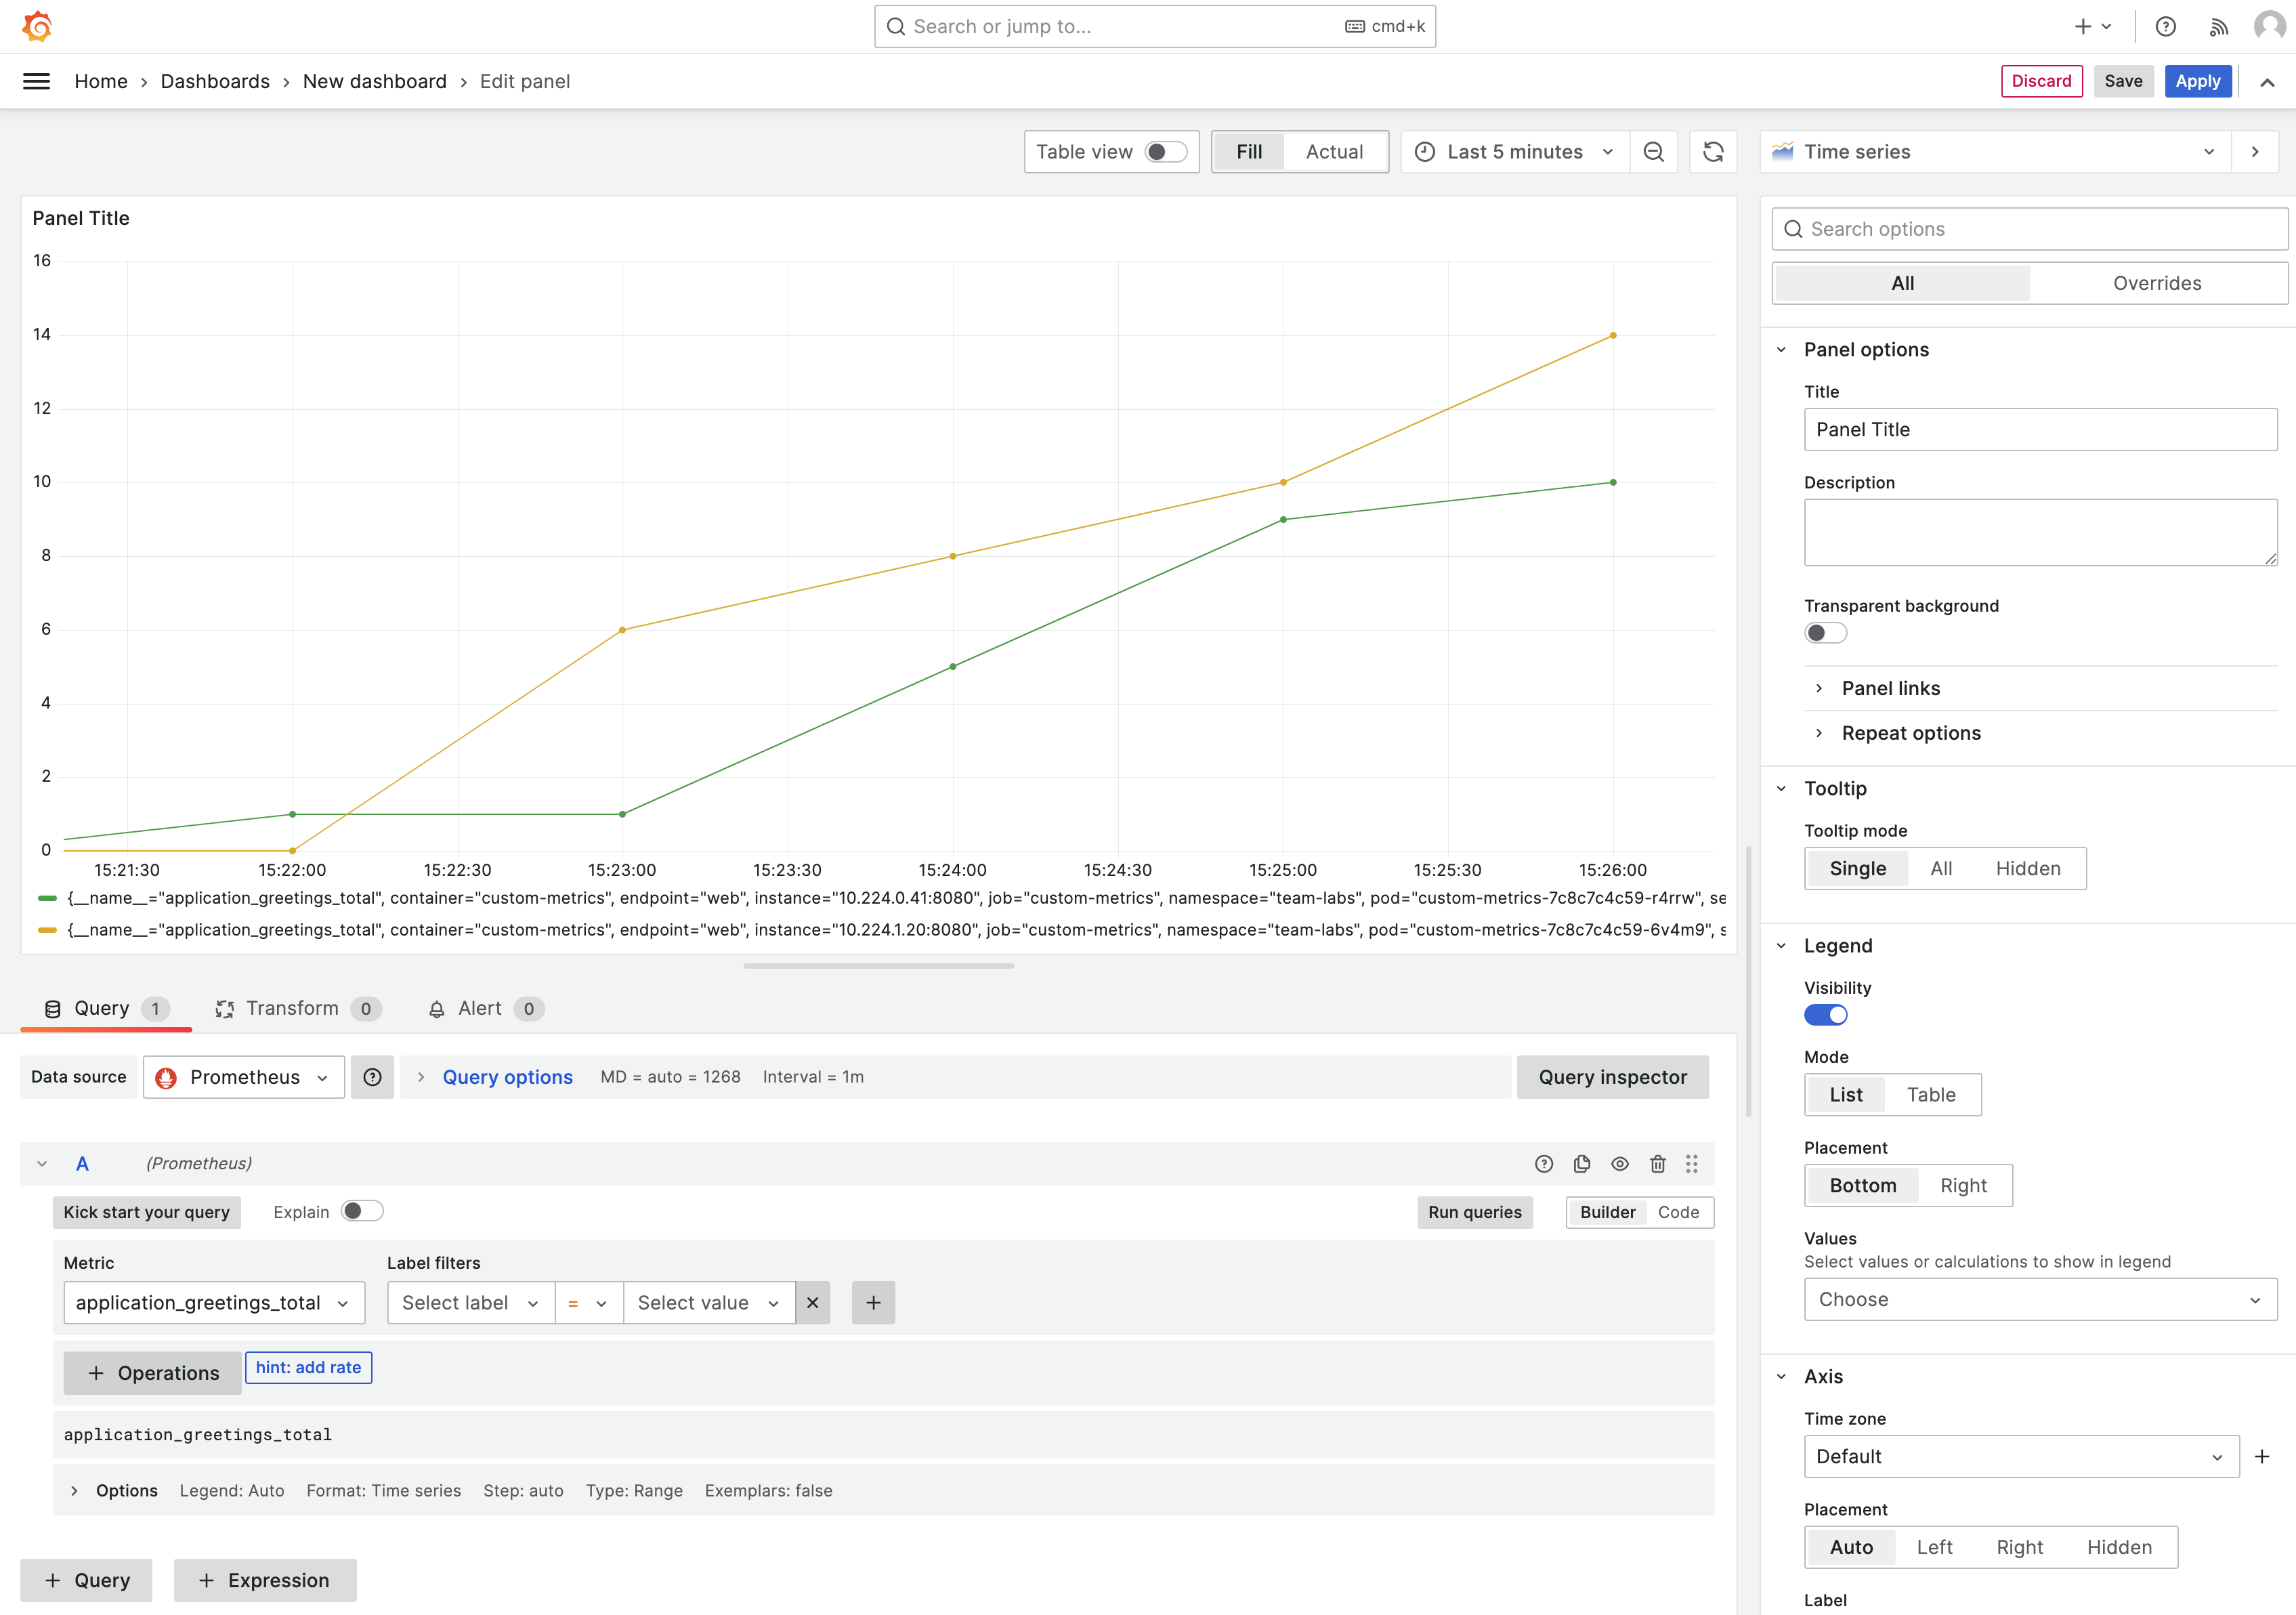
In the
Acollapsible section, select a metric from theMetricdrop-down list. In our example we use theapplication_greetings_totalmetric -
Click
Run queries -
You should now see a
Time seriesgraph like this:
- Save the dashboard in Grafana
Make the dashboard persistent
You know know how to create a dashboard in Grafana using custom metrics. You could now save the dashboard, but if Grafana would get re-started, the dashboard would be gone. To make the dashboard persistent we need to add it to a configmap.
- Go to
appsand openGitea - In the list of repositories there is a repository called
otomi/team-<team-name>-argocd. Go to this repository. - Click
Add Fileand thenNew File - Name the file
my-custom-dashboard.yaml - Add the following manifest to the file:
apiVersion: v1
kind: ConfigMap
metadata:
  name: my-custom-dashboard
  labels:
    grafana_dashboard: "1"
    release: grafana-dashboards-labs # change labs to the name of your team
data:
  my-dashboard.json: |-
    # paste your dashboard json here
- Before commiting changes, go back to Grafana
- Click on
Dashboard settings(in the top right) - In the left menu click
JSON model - Copy the JSON model and paste it into the ConfigMap. Make sure to indent with 4
- Delete the dashboard created in Grafana
- Commit changes in Gitea
The dashboard will now automatically be loaded into Grafana.