Using custom metrics
What are custom metrics
Prometheus will collect all kind of standard container metrics like CPU and memory usage, but no (custom) business or customer metrics like the number of customers who logged into your app each hour.
To be able to collect custom metrics you will need to expose this data in your code. This is called instrumentation of code and can include annotating the code with metadata, or adding in logic to calculate and expose data.
Instrumenting code means you write code to expose information about the technical, business, and customer context. This information can then be collected and analyzed using Prometheus and Grafana.
In this lab we'll not dive into the way how to instrument your code. We will use a container that exposes custom metrics and then show how the metrics can be collected and analysed.
Create a Workload
-
Go to the Catalog and click on the
k8s-deploymenttemplate -
Click on the
Valuestab -
Fill in the name
custom-metrics -
Use the following values:
image:
  repository: quay.io/rbaumgar/monitor-demo-app-jvm
  pullPolicy: IfNotPresent
  tag: latest
containerPorts:
  - name: web
    containerPort: 8080
    protocol: TCP
servicePorts:
  - port: 8080
    targetPort: 8080
    protocol: TCP
    name: web
replicaCount: 2
serviceMonitor:
  create: true
  endpoints:
    - interval: 30s
      port: web
      scheme: http
      path: /q/metrics
- Click
Submitand thenDeploy Changes
Check the status of the ServiceMonitor
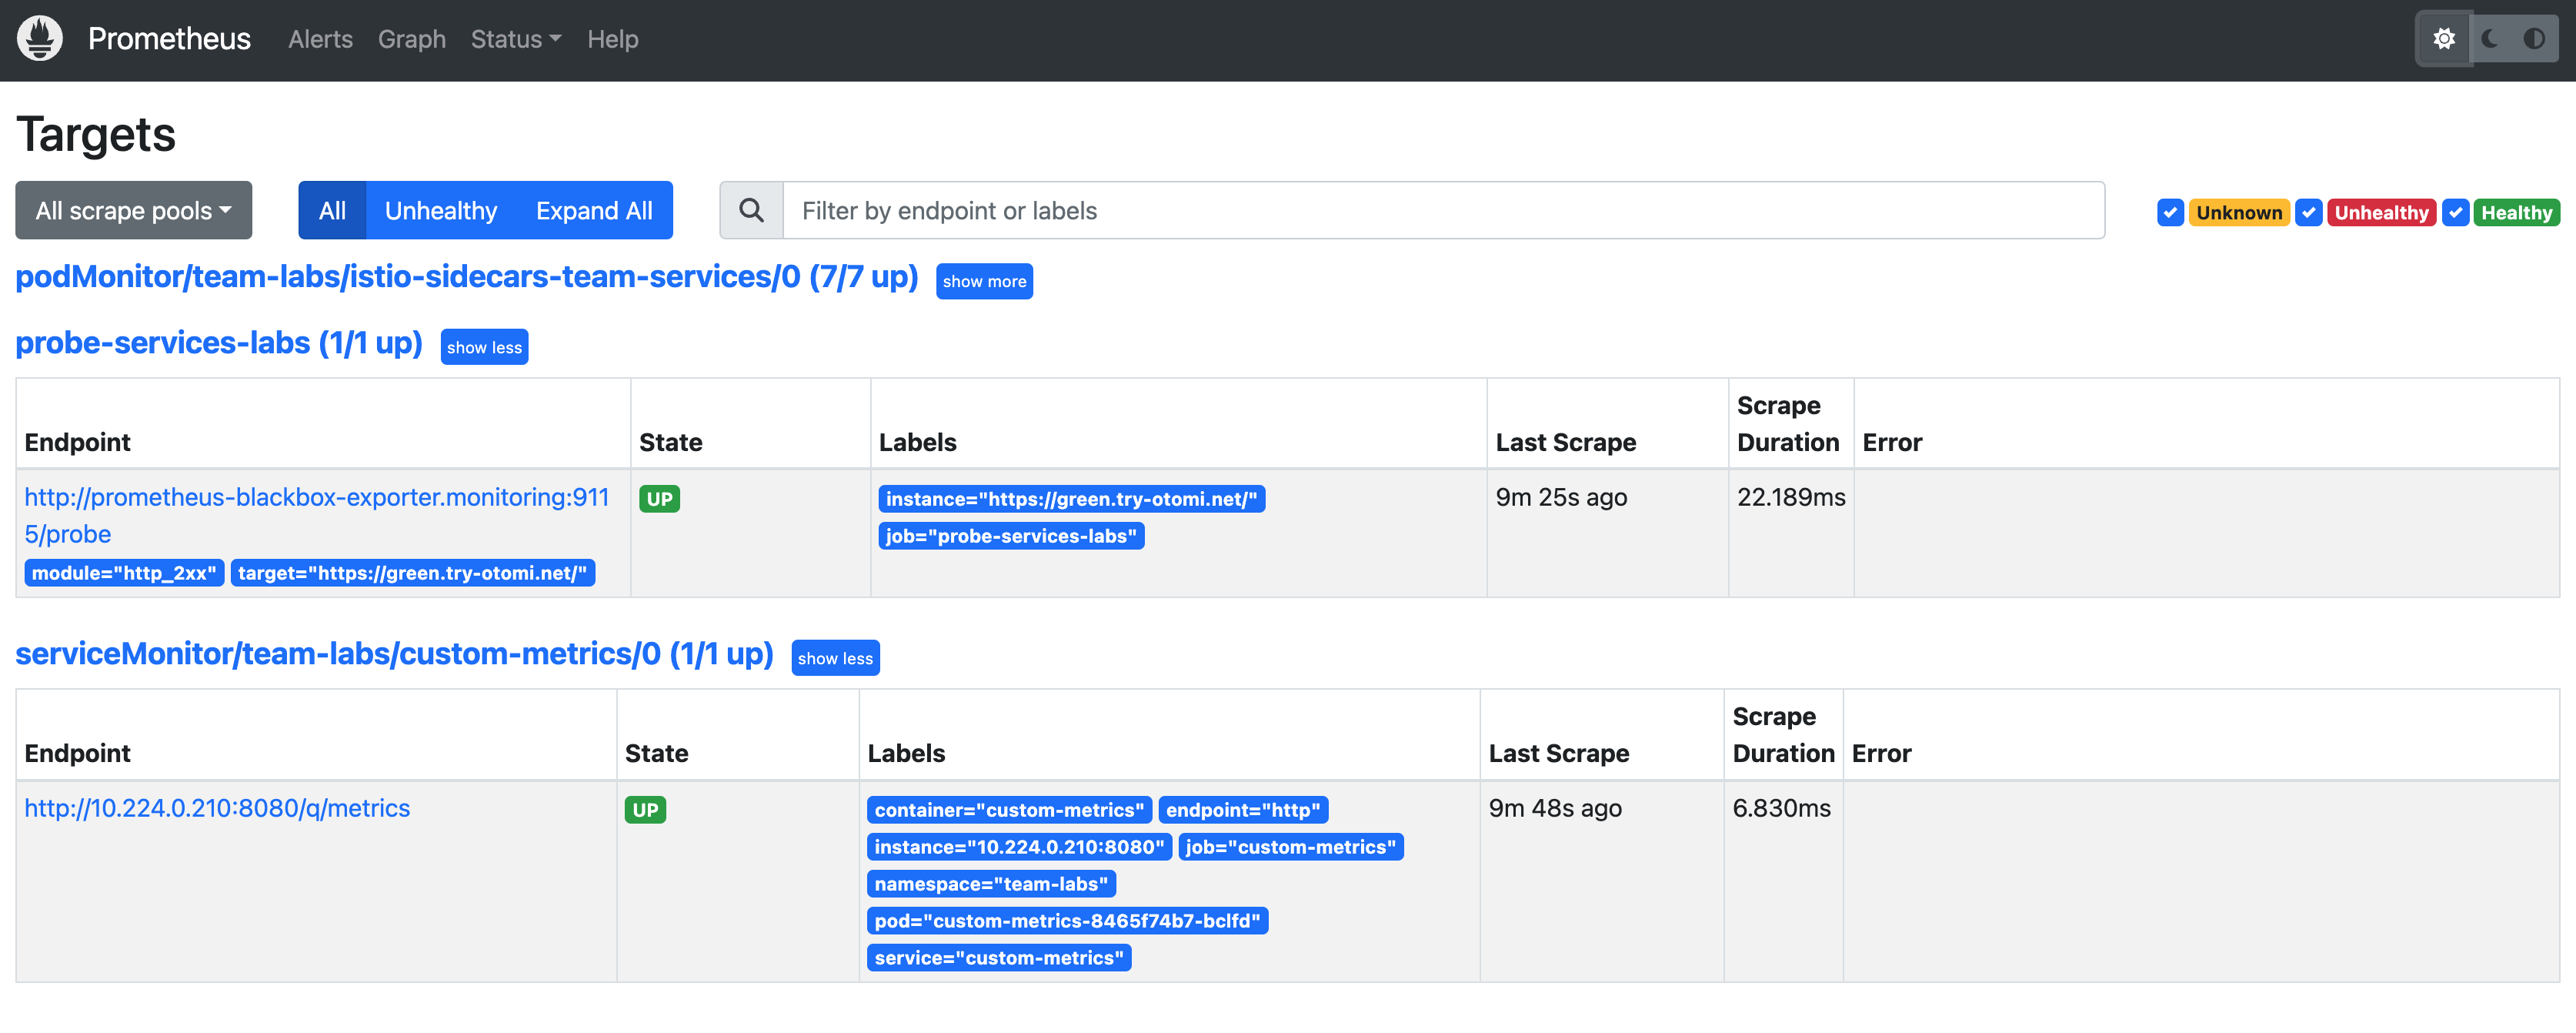
Check if the ServiveMonitor has been picked up by Prometheus:
- In the left menu go to
Apps - Click on the
Prometheusapp - In Prometheus, click on
Statusin the top menu and then clickTargets - You will now see that the ServiceMonitor has the
StateUP:
Okay, our metrics are now being scraped by the Team's Prometheus. Before we continue, let's first generate some load:
-
Go to the Expose services lab and expose the
custom-metricsservice -
Run the following command in your terminal:
for i in {1..1000}; do curl https://custom-metrics-labs.<your-domain>/hello; sleep 10; done
- Wait for approximately 10 minutes...
See the custom metrics
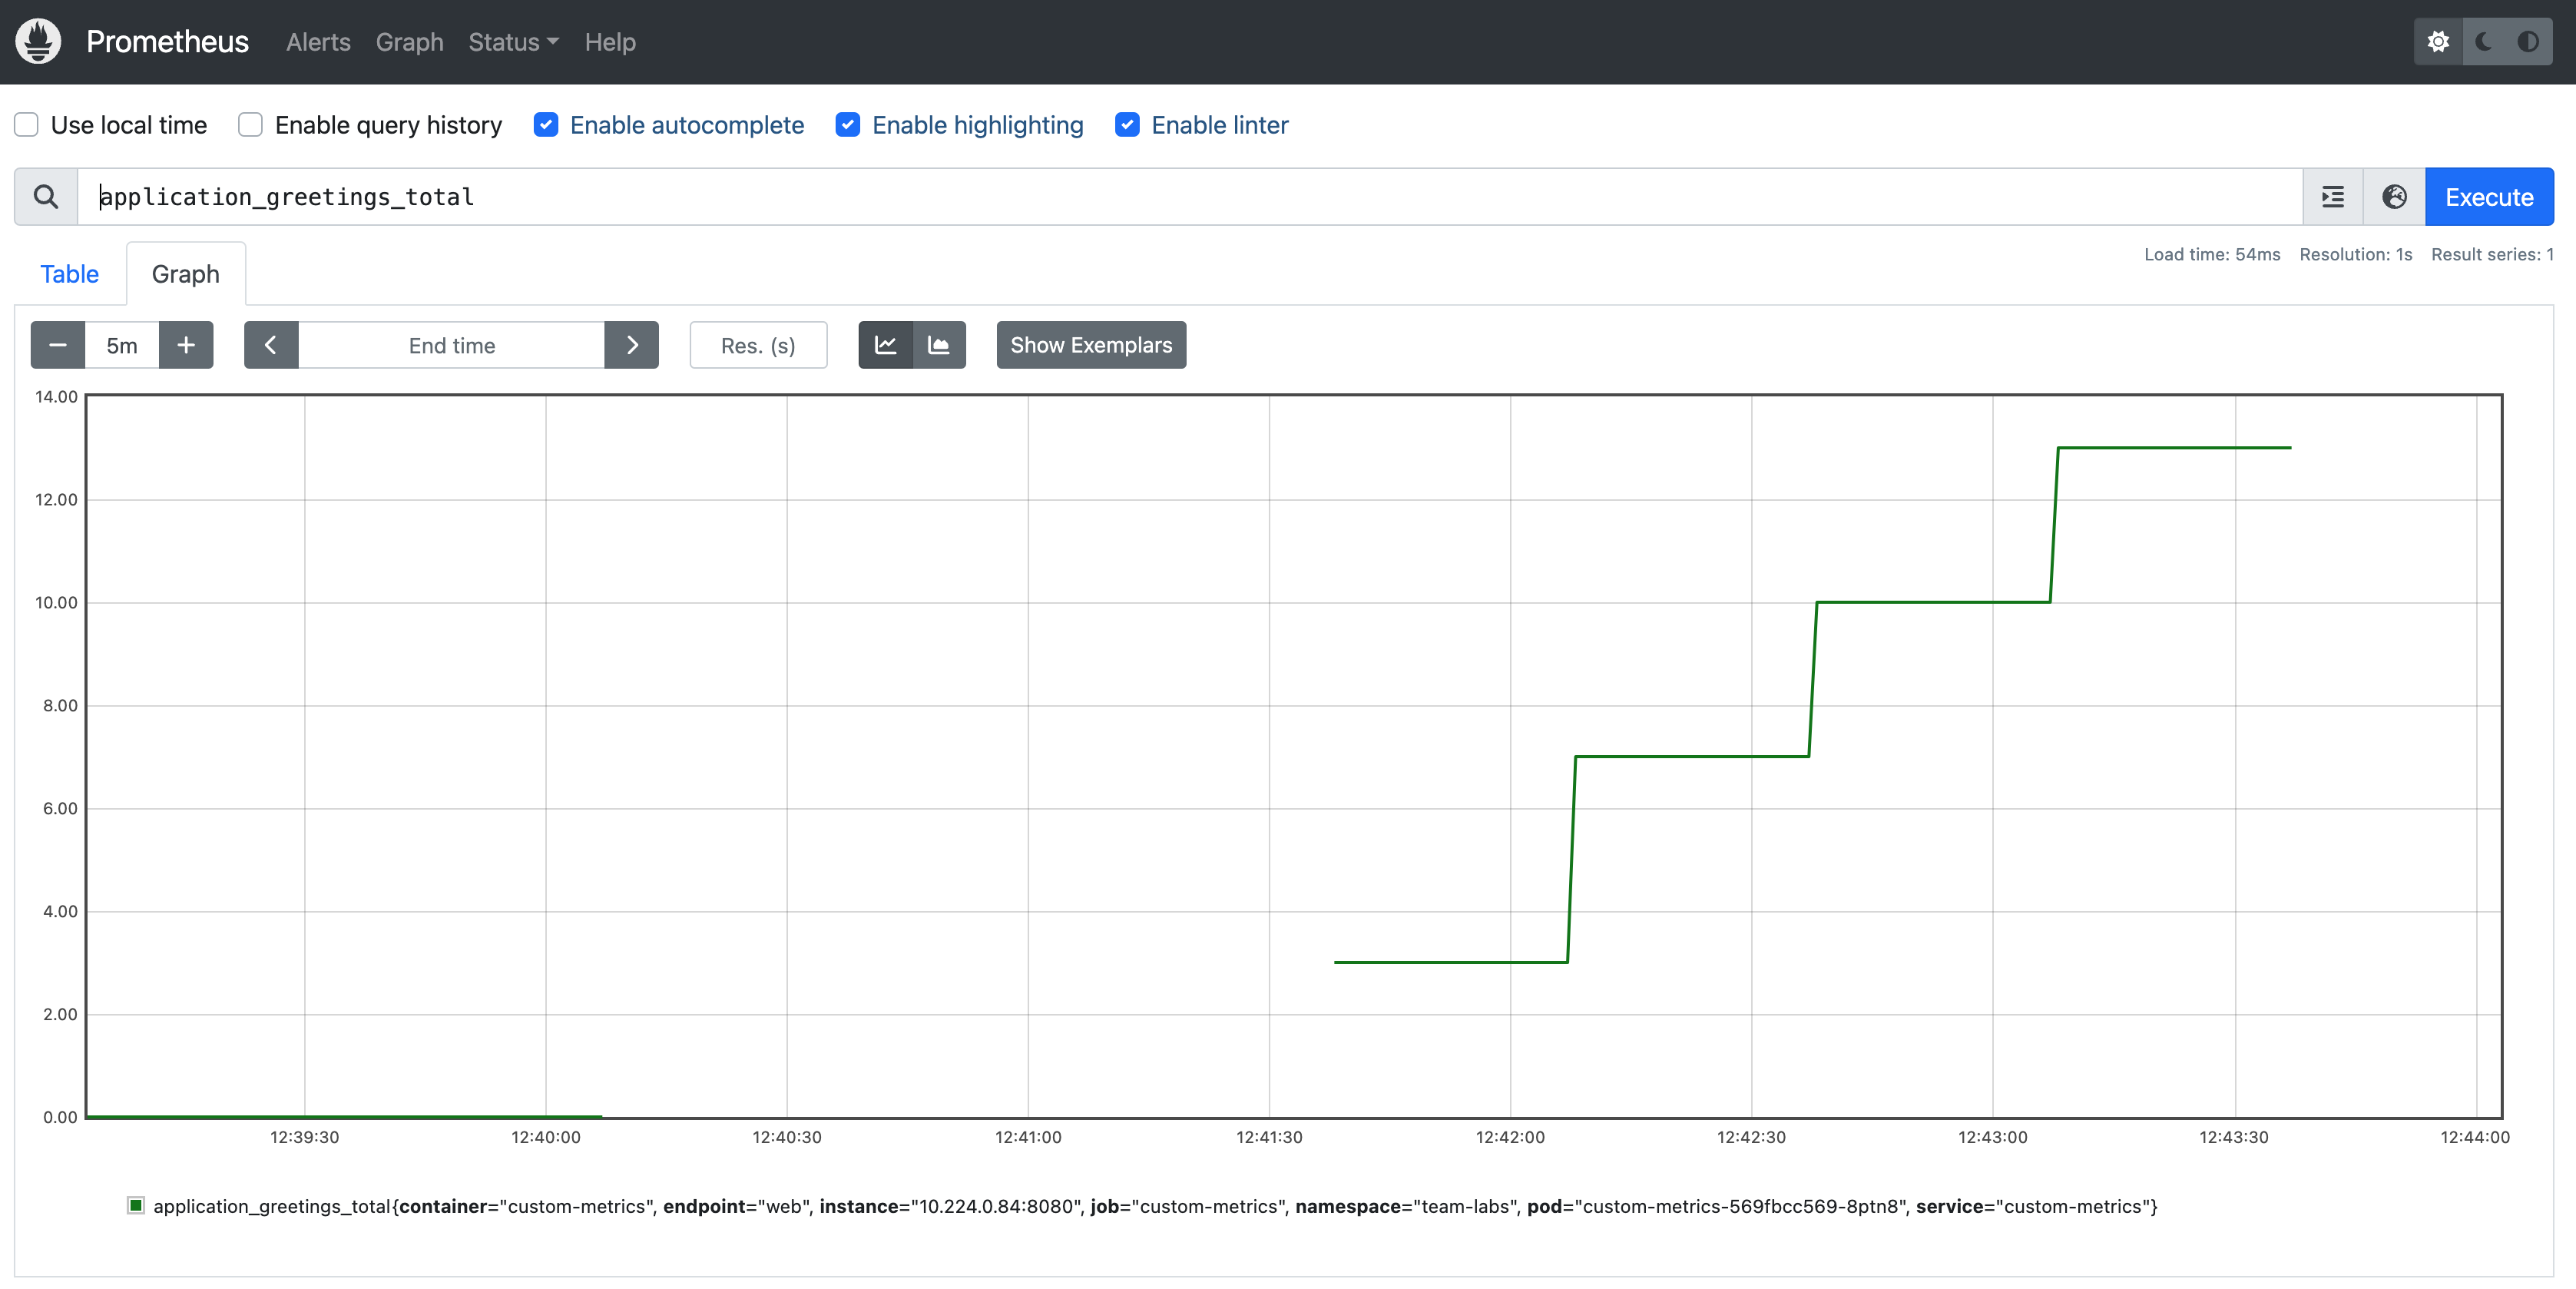
To see the metrics:
- Open the
Prometheusapp - In Prometheus, fill in the following Expression:
application_greetings_total - Click on
Graph - You should now see the following:
Next steps
Prometheus is now scraping our custom metrics. You can now use these metrics to:
- Create a dashboard in Grafana in the lab Create custom dashboards
- Create rules and send alerts in the lab Create custom rules