OpenTelemetry
In order to make a system observable, it must be instrumented. Language specific implementation of OpenTelemetry provides a way to instrument your application without touching your source code. In this lab we're going to instrument a Java application.
Prerequisites
For this lab it is required to:
- Enable
Tempo - Enable
Otel - Enable
Loki - Enable
Grafana - Enable tracing for
IstioandNginx Ingress
Build an image from source code
For this lab we're going to use the Spring PetClinic Sample Application. Follow these steps to build an image from source code:
Using a Gitea repository is not required. You can also build using public repositories.
- Create a new repo called
petclinic - Clone the Spring PetClinic Sample Application:
git clone https://github.com/spring-projects/spring-petclinic.git
cd spring-petclinic
- Mirror the Spring PetClinic Sample Application to your
petclincrepo:
git push --mirror https://gitea.<your-domain>/<your-user-name>/petclinic.git
- Go to
Buildsin the left menu and clickCreate Build - Fill in the Build name
petclinic - Choose
Buildpacks - Fill in the
Repo URLwith thepetclinicGitea repo you created - Click
Submit
Create a workload from the developer catalog
Go to the list of Builds and add the repository of the petclinc build to your clipboard. Remember that the tag is latest.
- Go to
Workloadsin the left menu and click onCreate Workload - Select
k8s-deployment-otelfrom the catalog - Add the Name
petclinicfor the workload - Leave the
Auto image updatertoDisabled - In the workload
values, change the following parameters:
image:
  repository: <paste from clipboard>
  tag: latest
Because we're deploying a Java application here, maybe also change the resources:
resources:
  limits:
    cpu: 500m
    memory: 1Gi
  requests:
    cpu: 300m
    memory: 256Mi
- Click
Submit
Now click on Deploy Changes
Expose the service
- In the left menu panel under click
Servicesthen click onCreate Service - Select the
petclinicservice - Under
Exposure Ingress, selectIngressand use the default configuration - Click
Submit - Click
Deploy Changes
See traces
To be able to see traces, we'll first need to generate some requests. Click on the URL of the petclinic service and generate some requests.
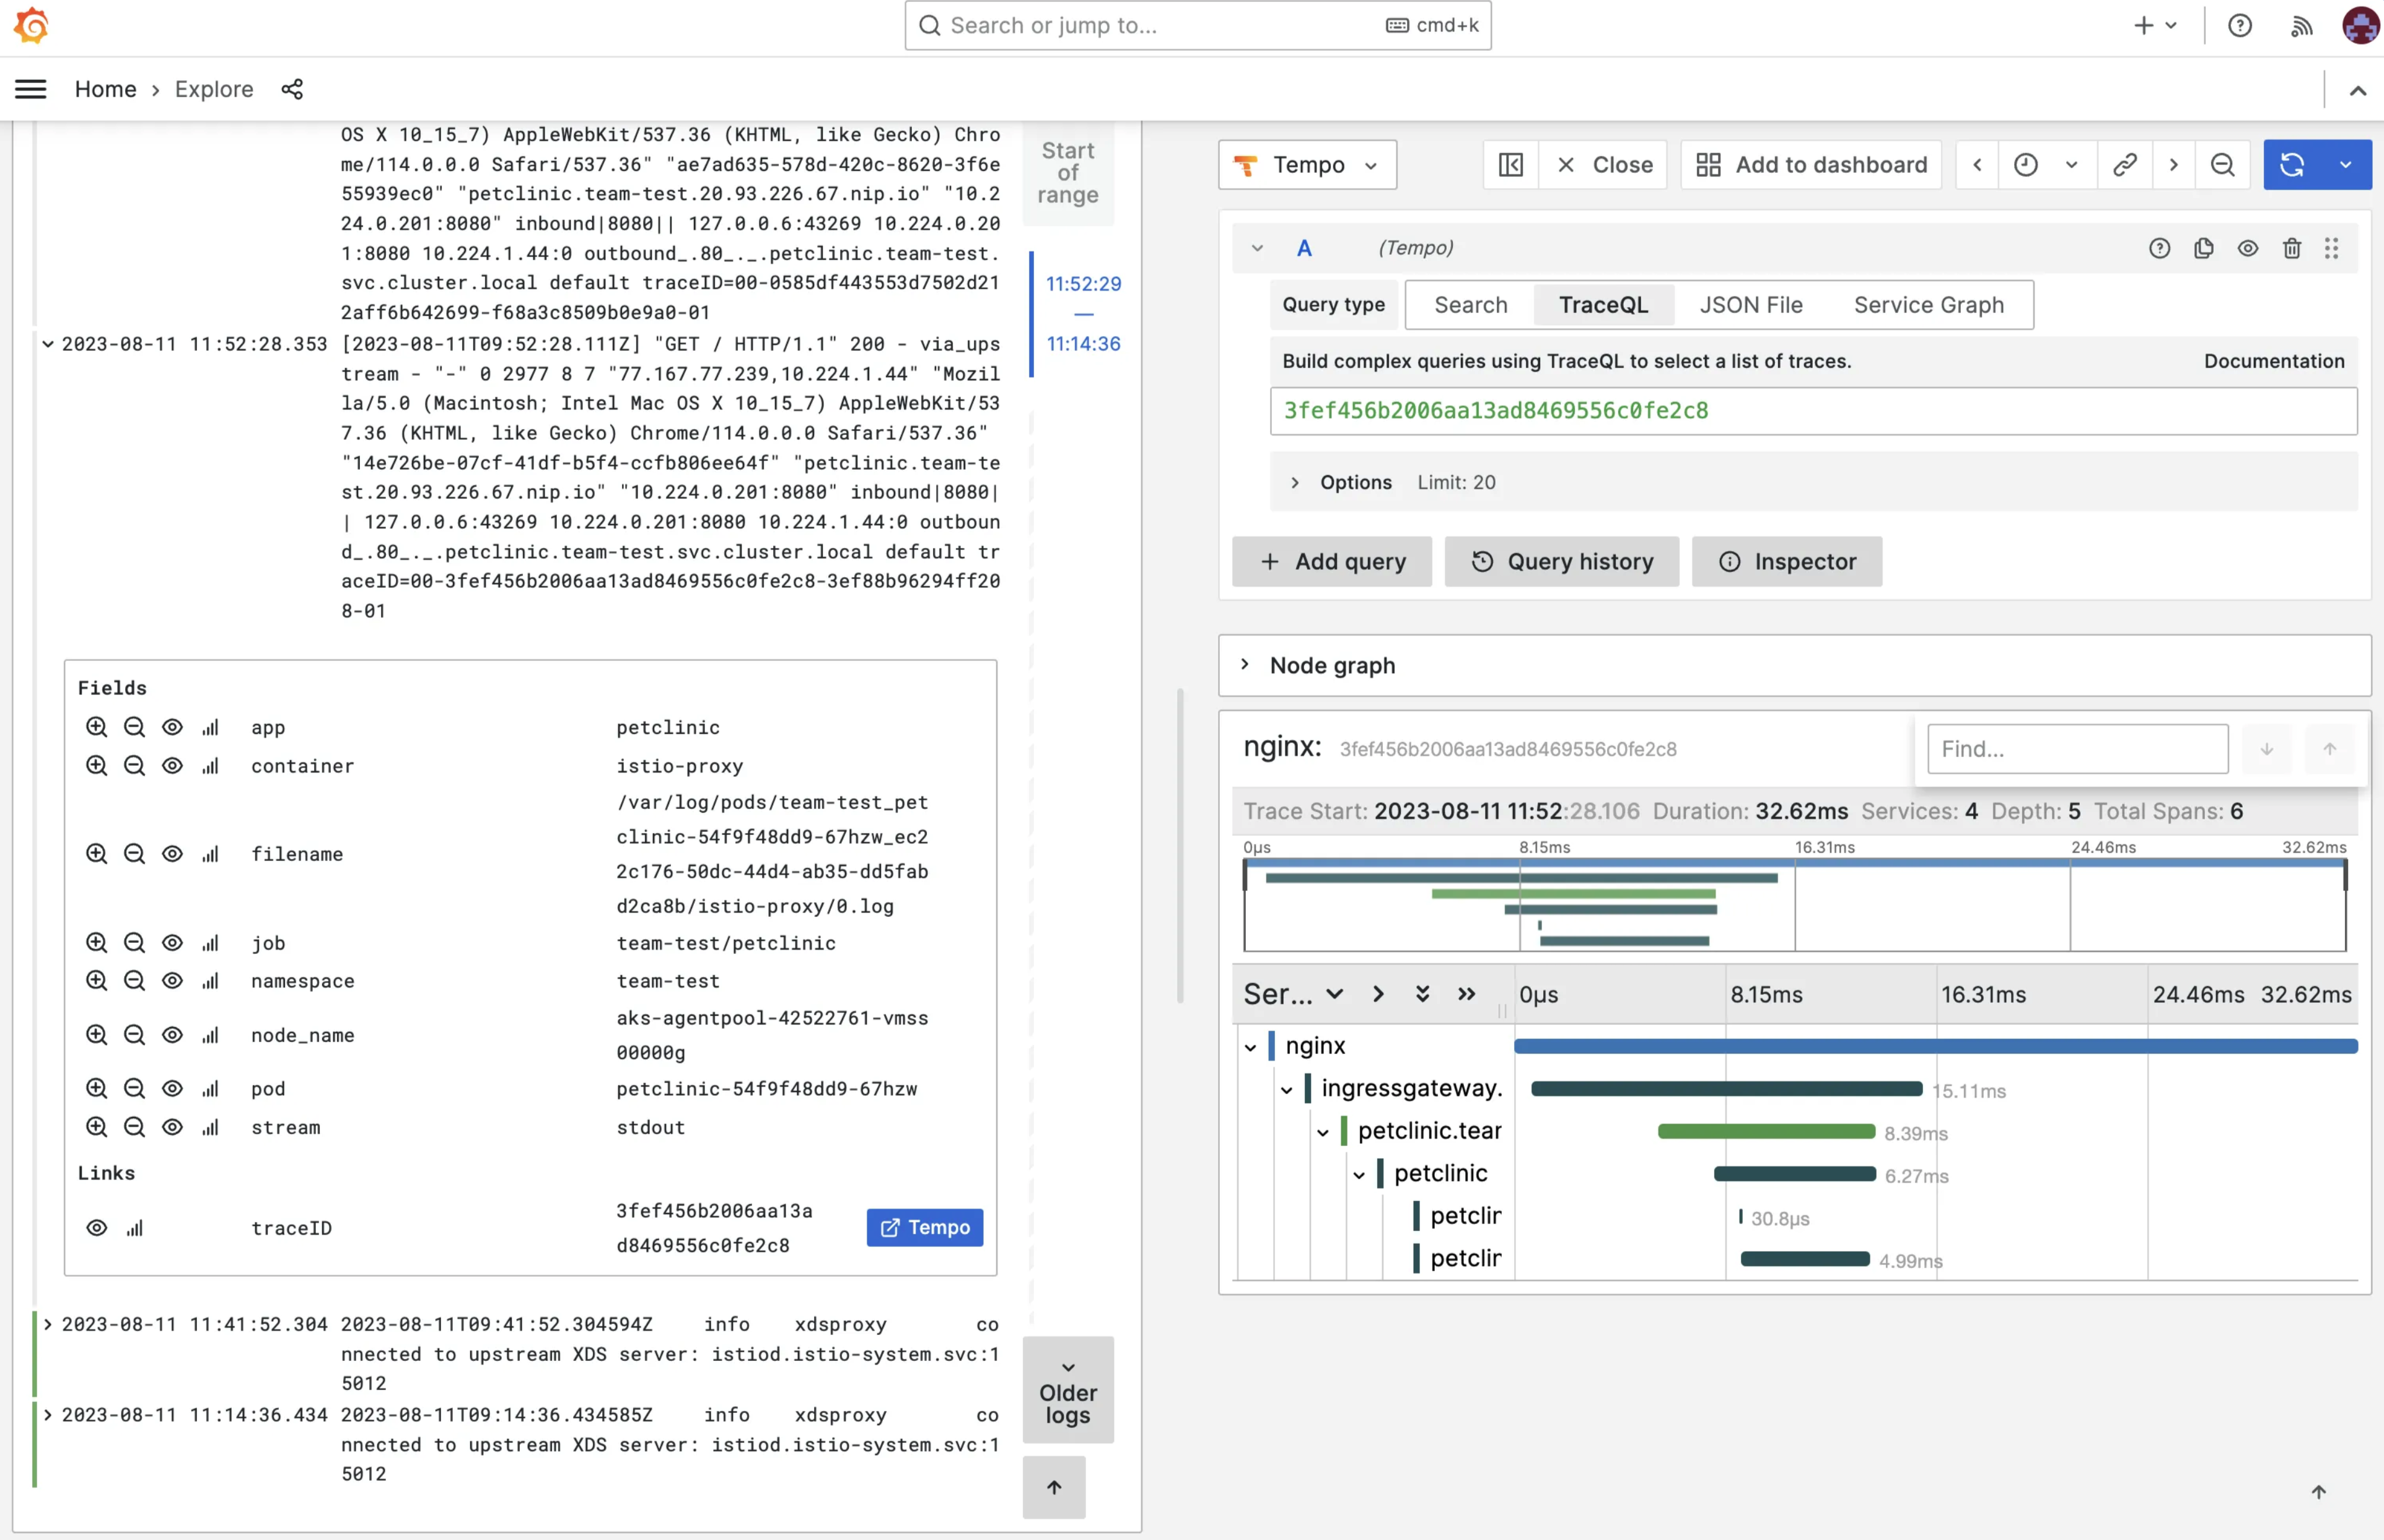
To see traces, you'll first need to find a TraceID of a trace. Go to Apps in the left menu and then click op Loki. Select the label App and select value petclinic.
Click on a log entry of a request. Note that the requests are logged by the Istio Envoy proxy. You will now see a link to the full trace in Grafana Tempo. Click on it.
If you don't see any traces, check and see if the pod runs the ghcr.io/open-telemetry/opentelemetry-operator/autoinstrumentation-java:1.26.0 container. Sometimes the pod starts before the Instrumentation resource has been created. If this is the case, restart the Pod
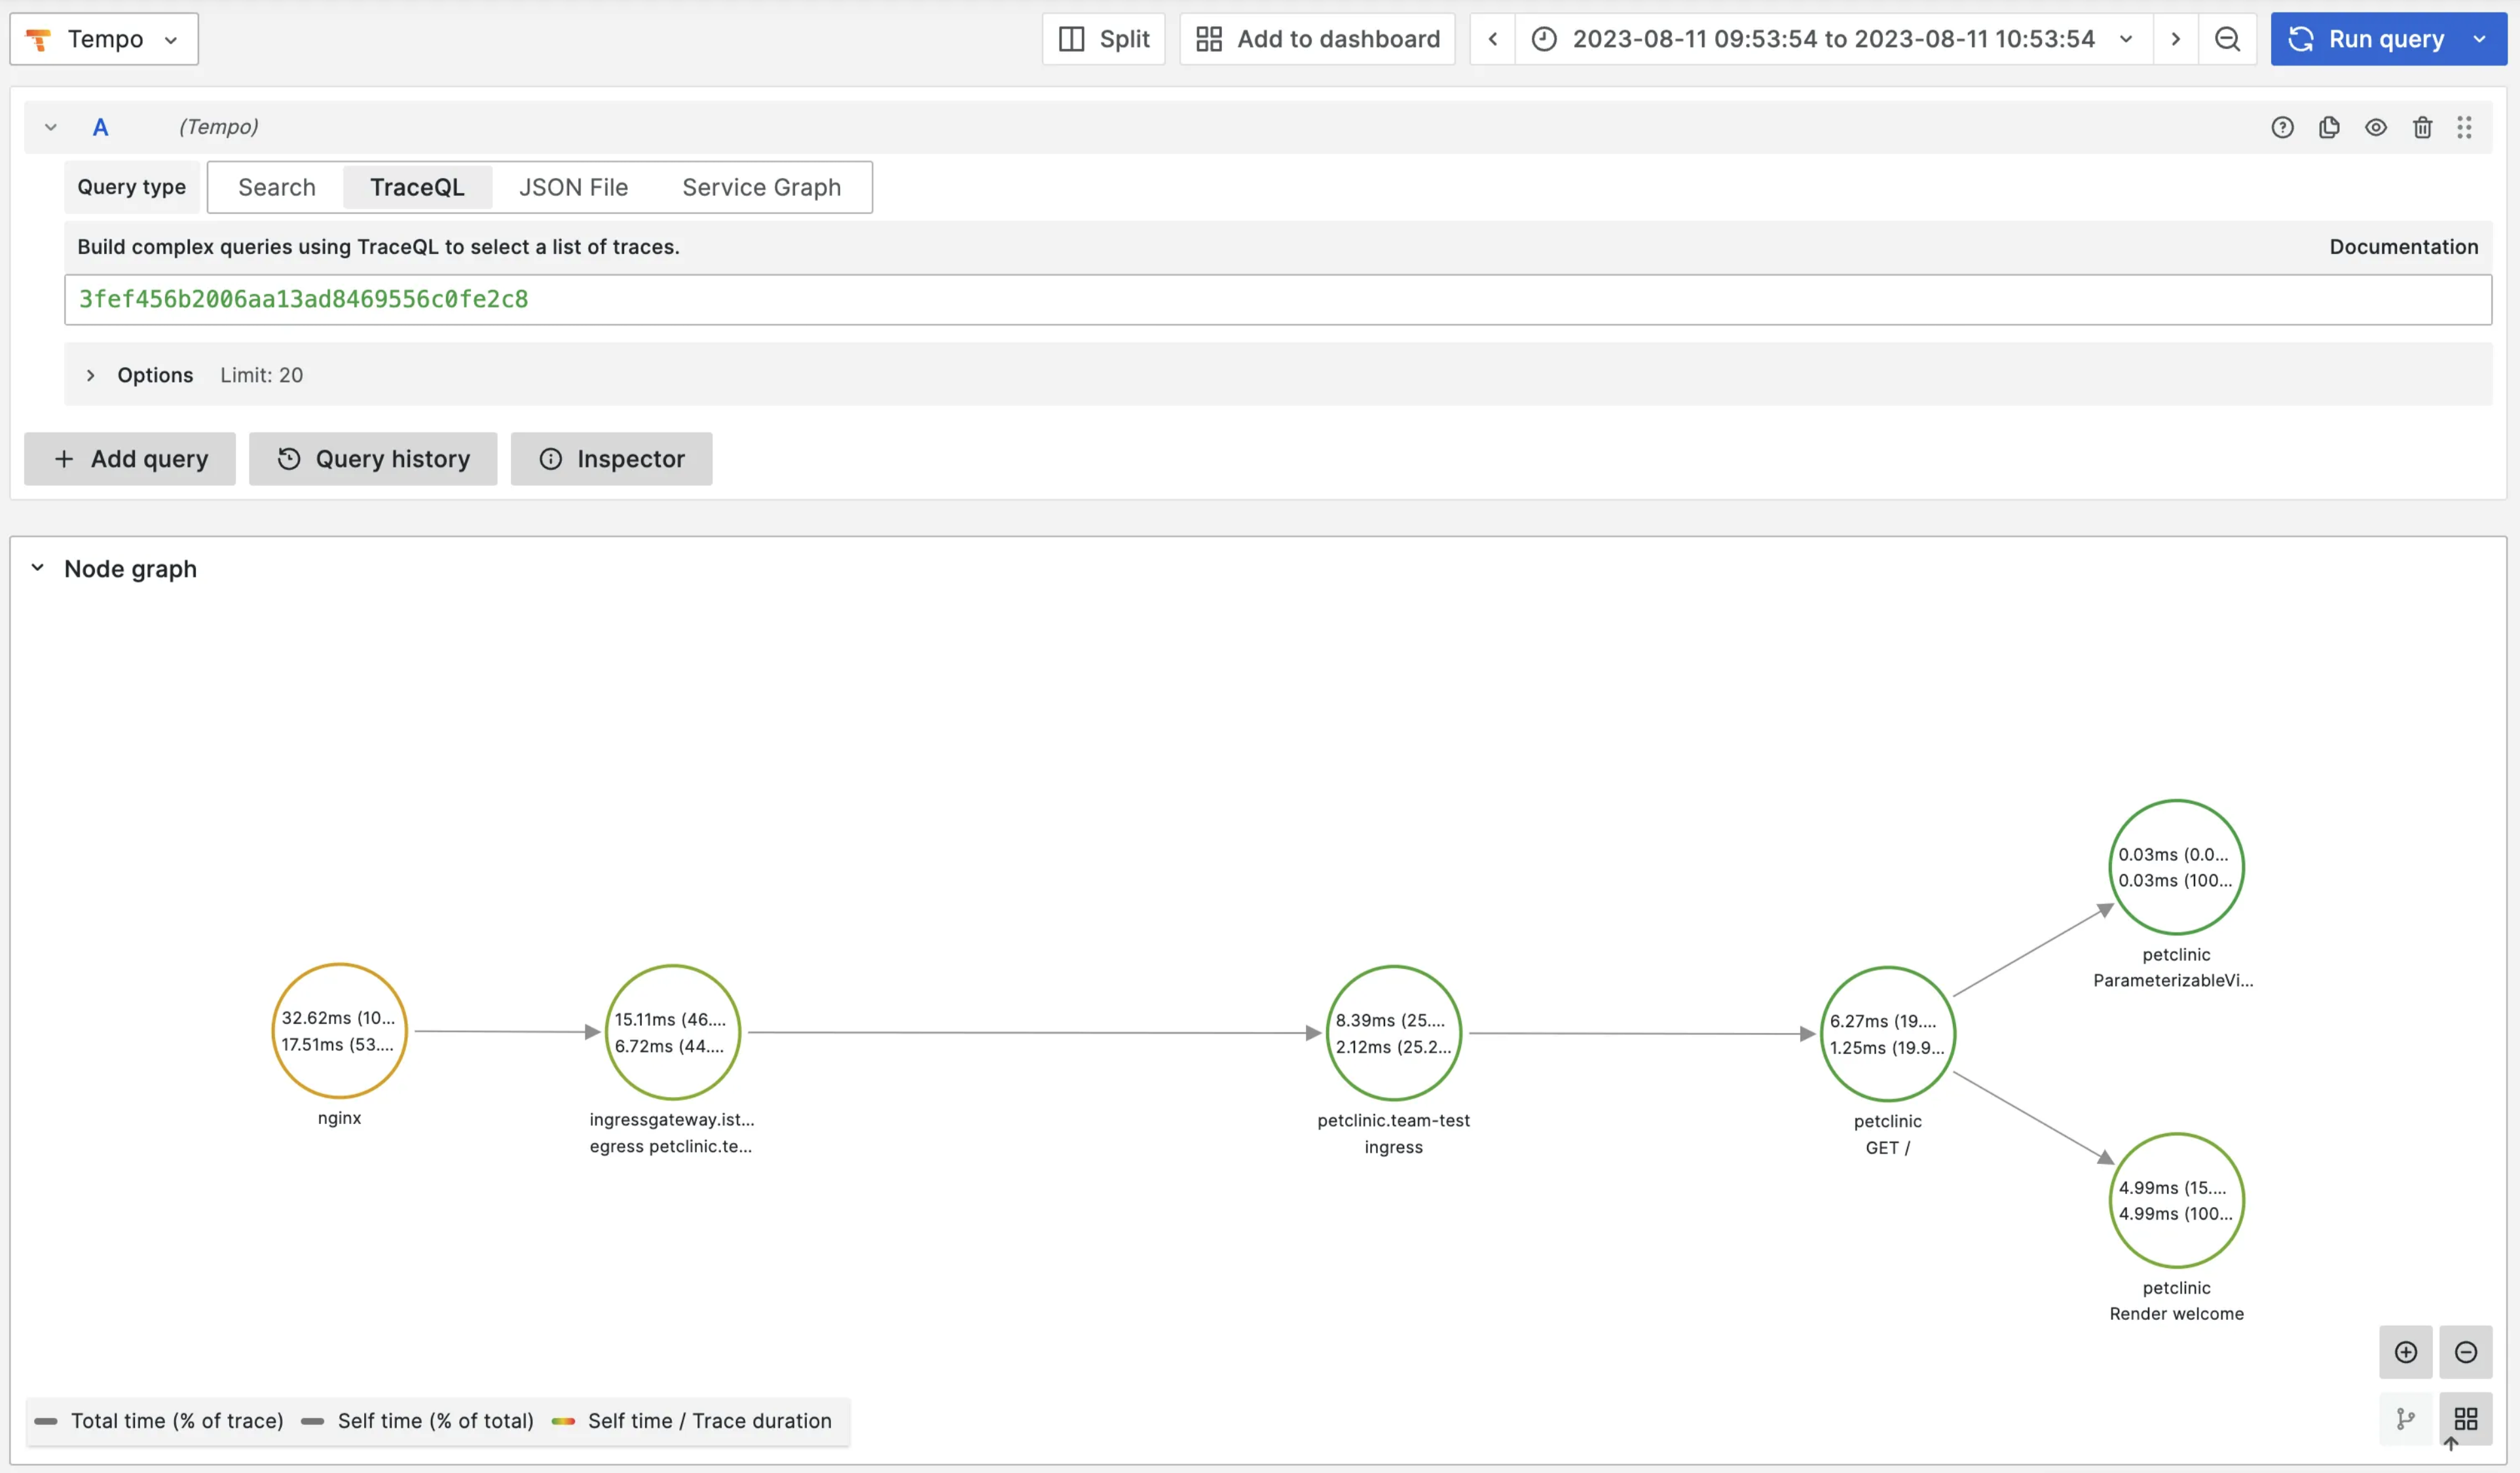
And when you click on the Node graph, you’ll see the complete flow: