Monitoring service availability
When your application is deployed, you would of course like to get an alert when you application (service) is not available anymore. To automatically monitor you applications for availability, Otomi automatically configures a prope to monitor your service.
Monitor your application for availability
-
Create a Service for your app in Otomi. The service can have an Exposure ingress of type
ClusterorIngress -
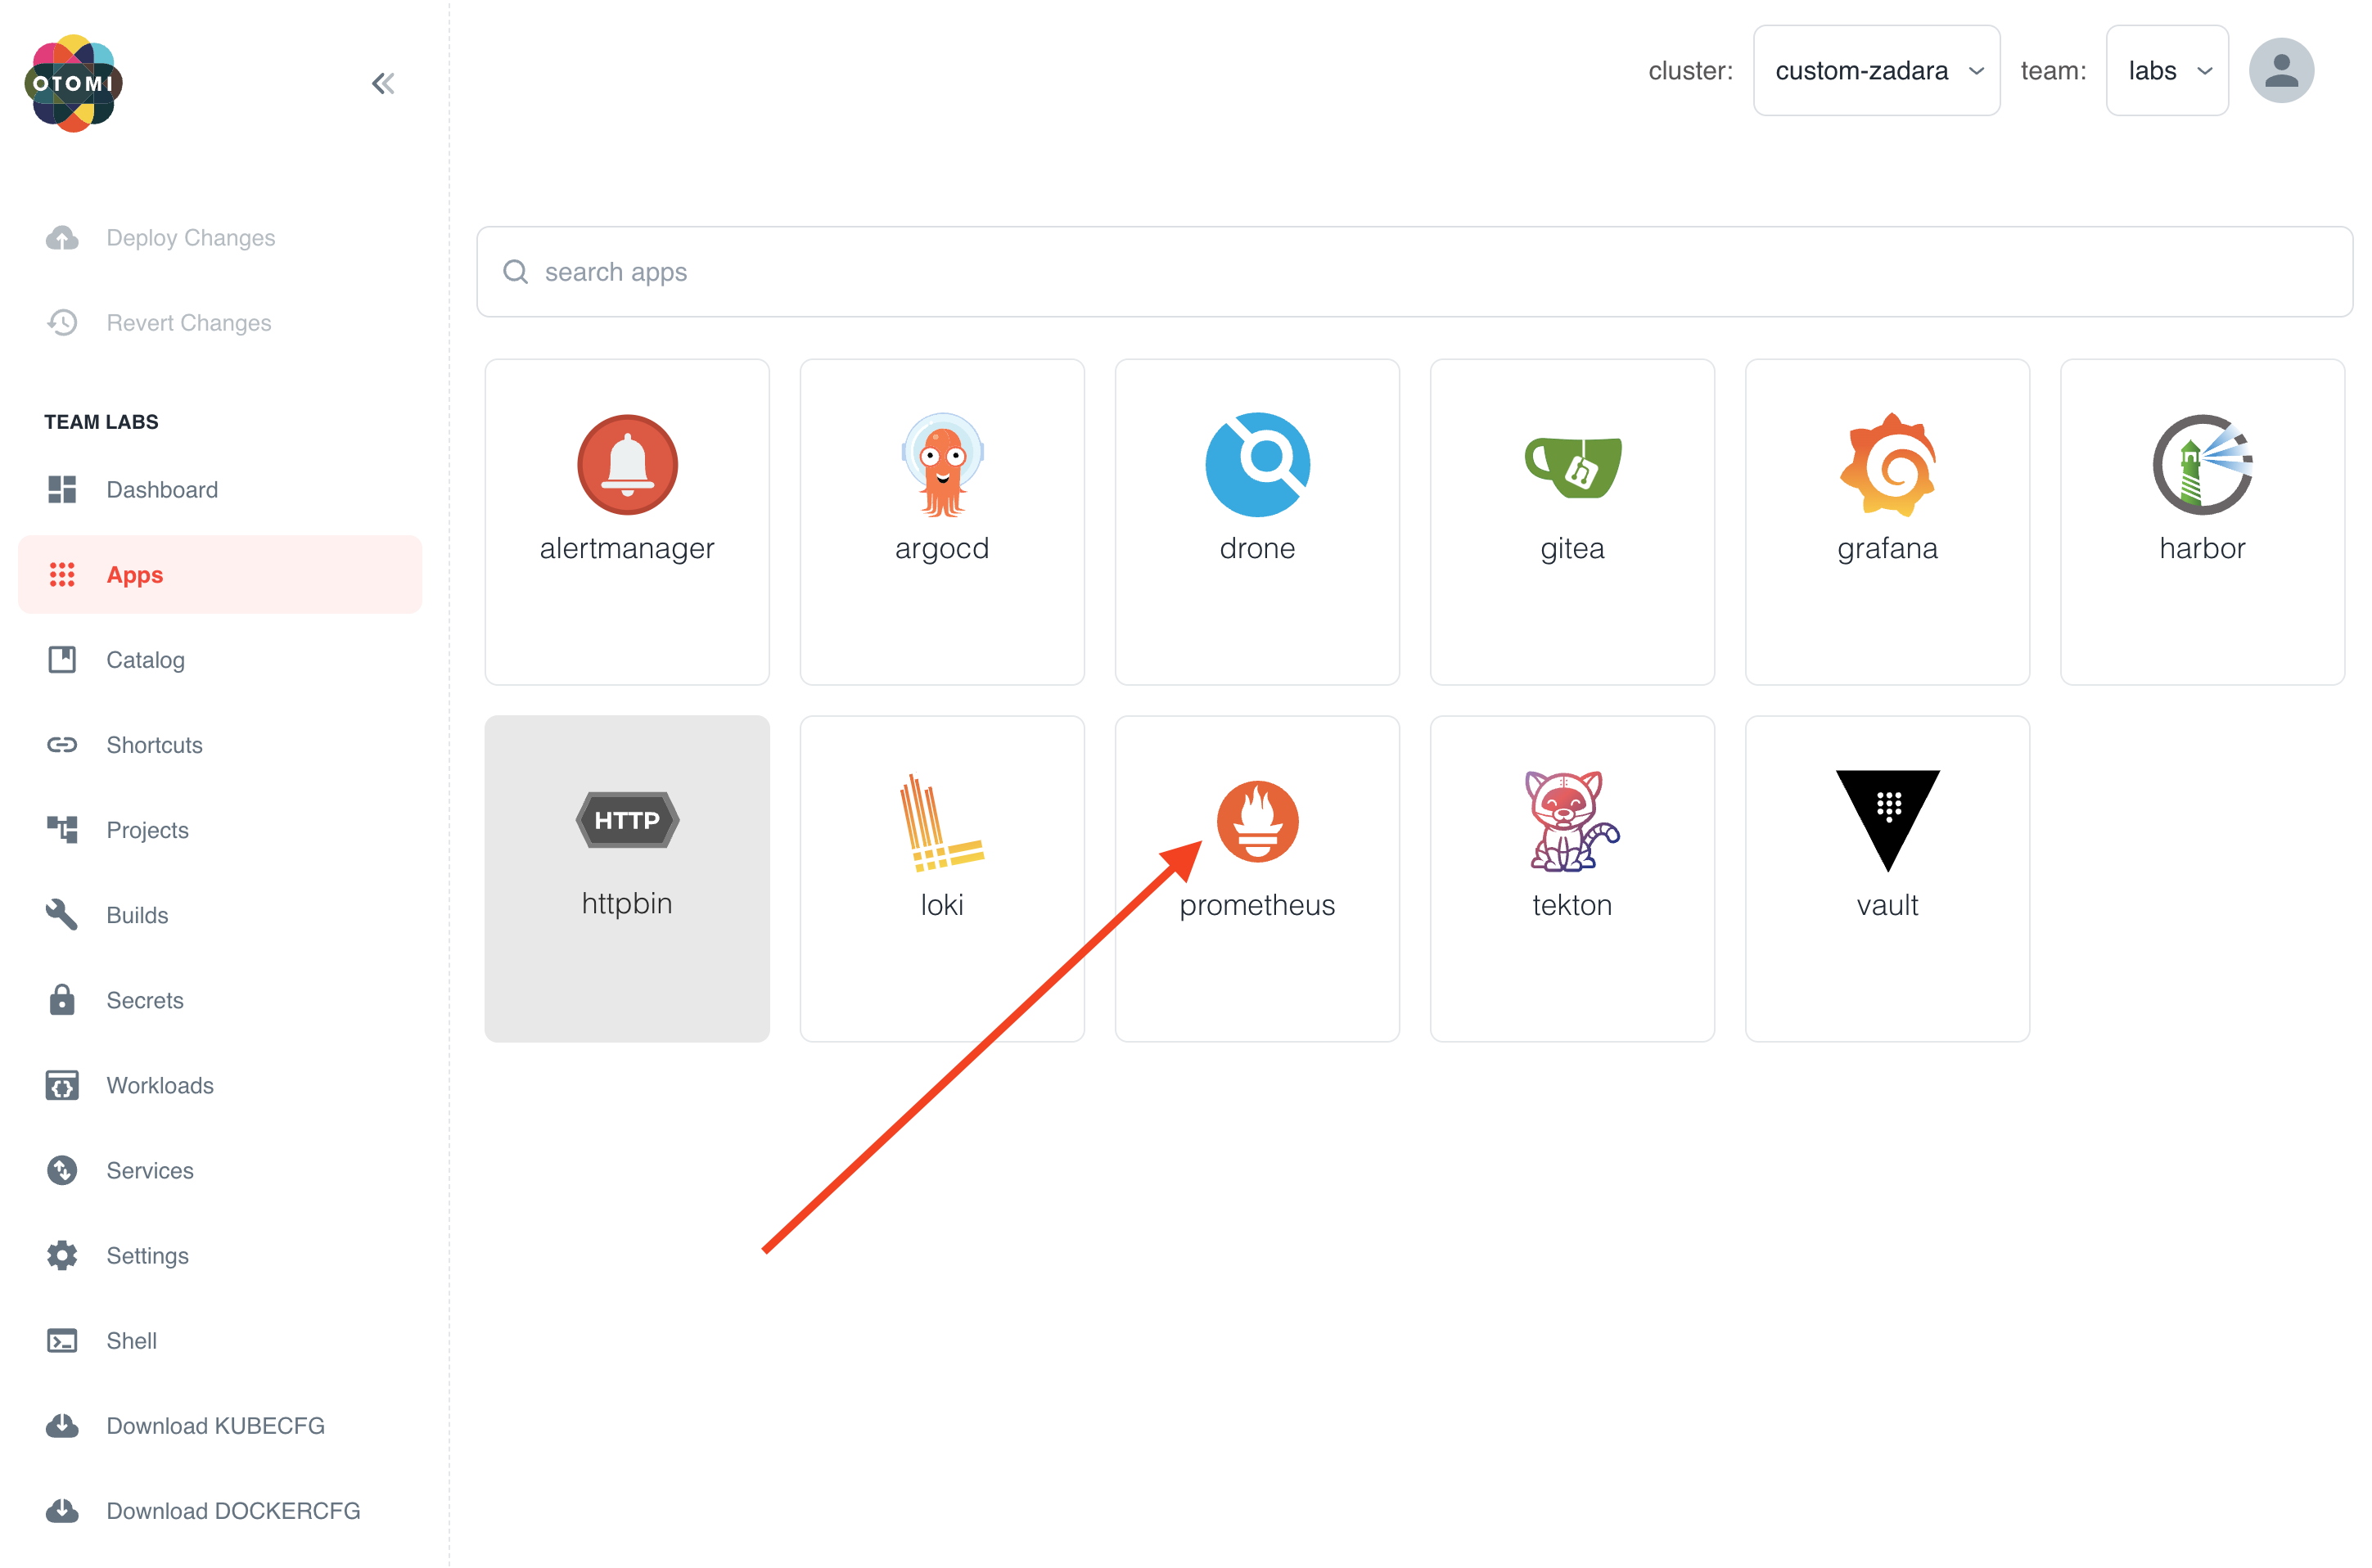
Open Prometheus
- In Prometheus, Go to
Statusand click onTargets
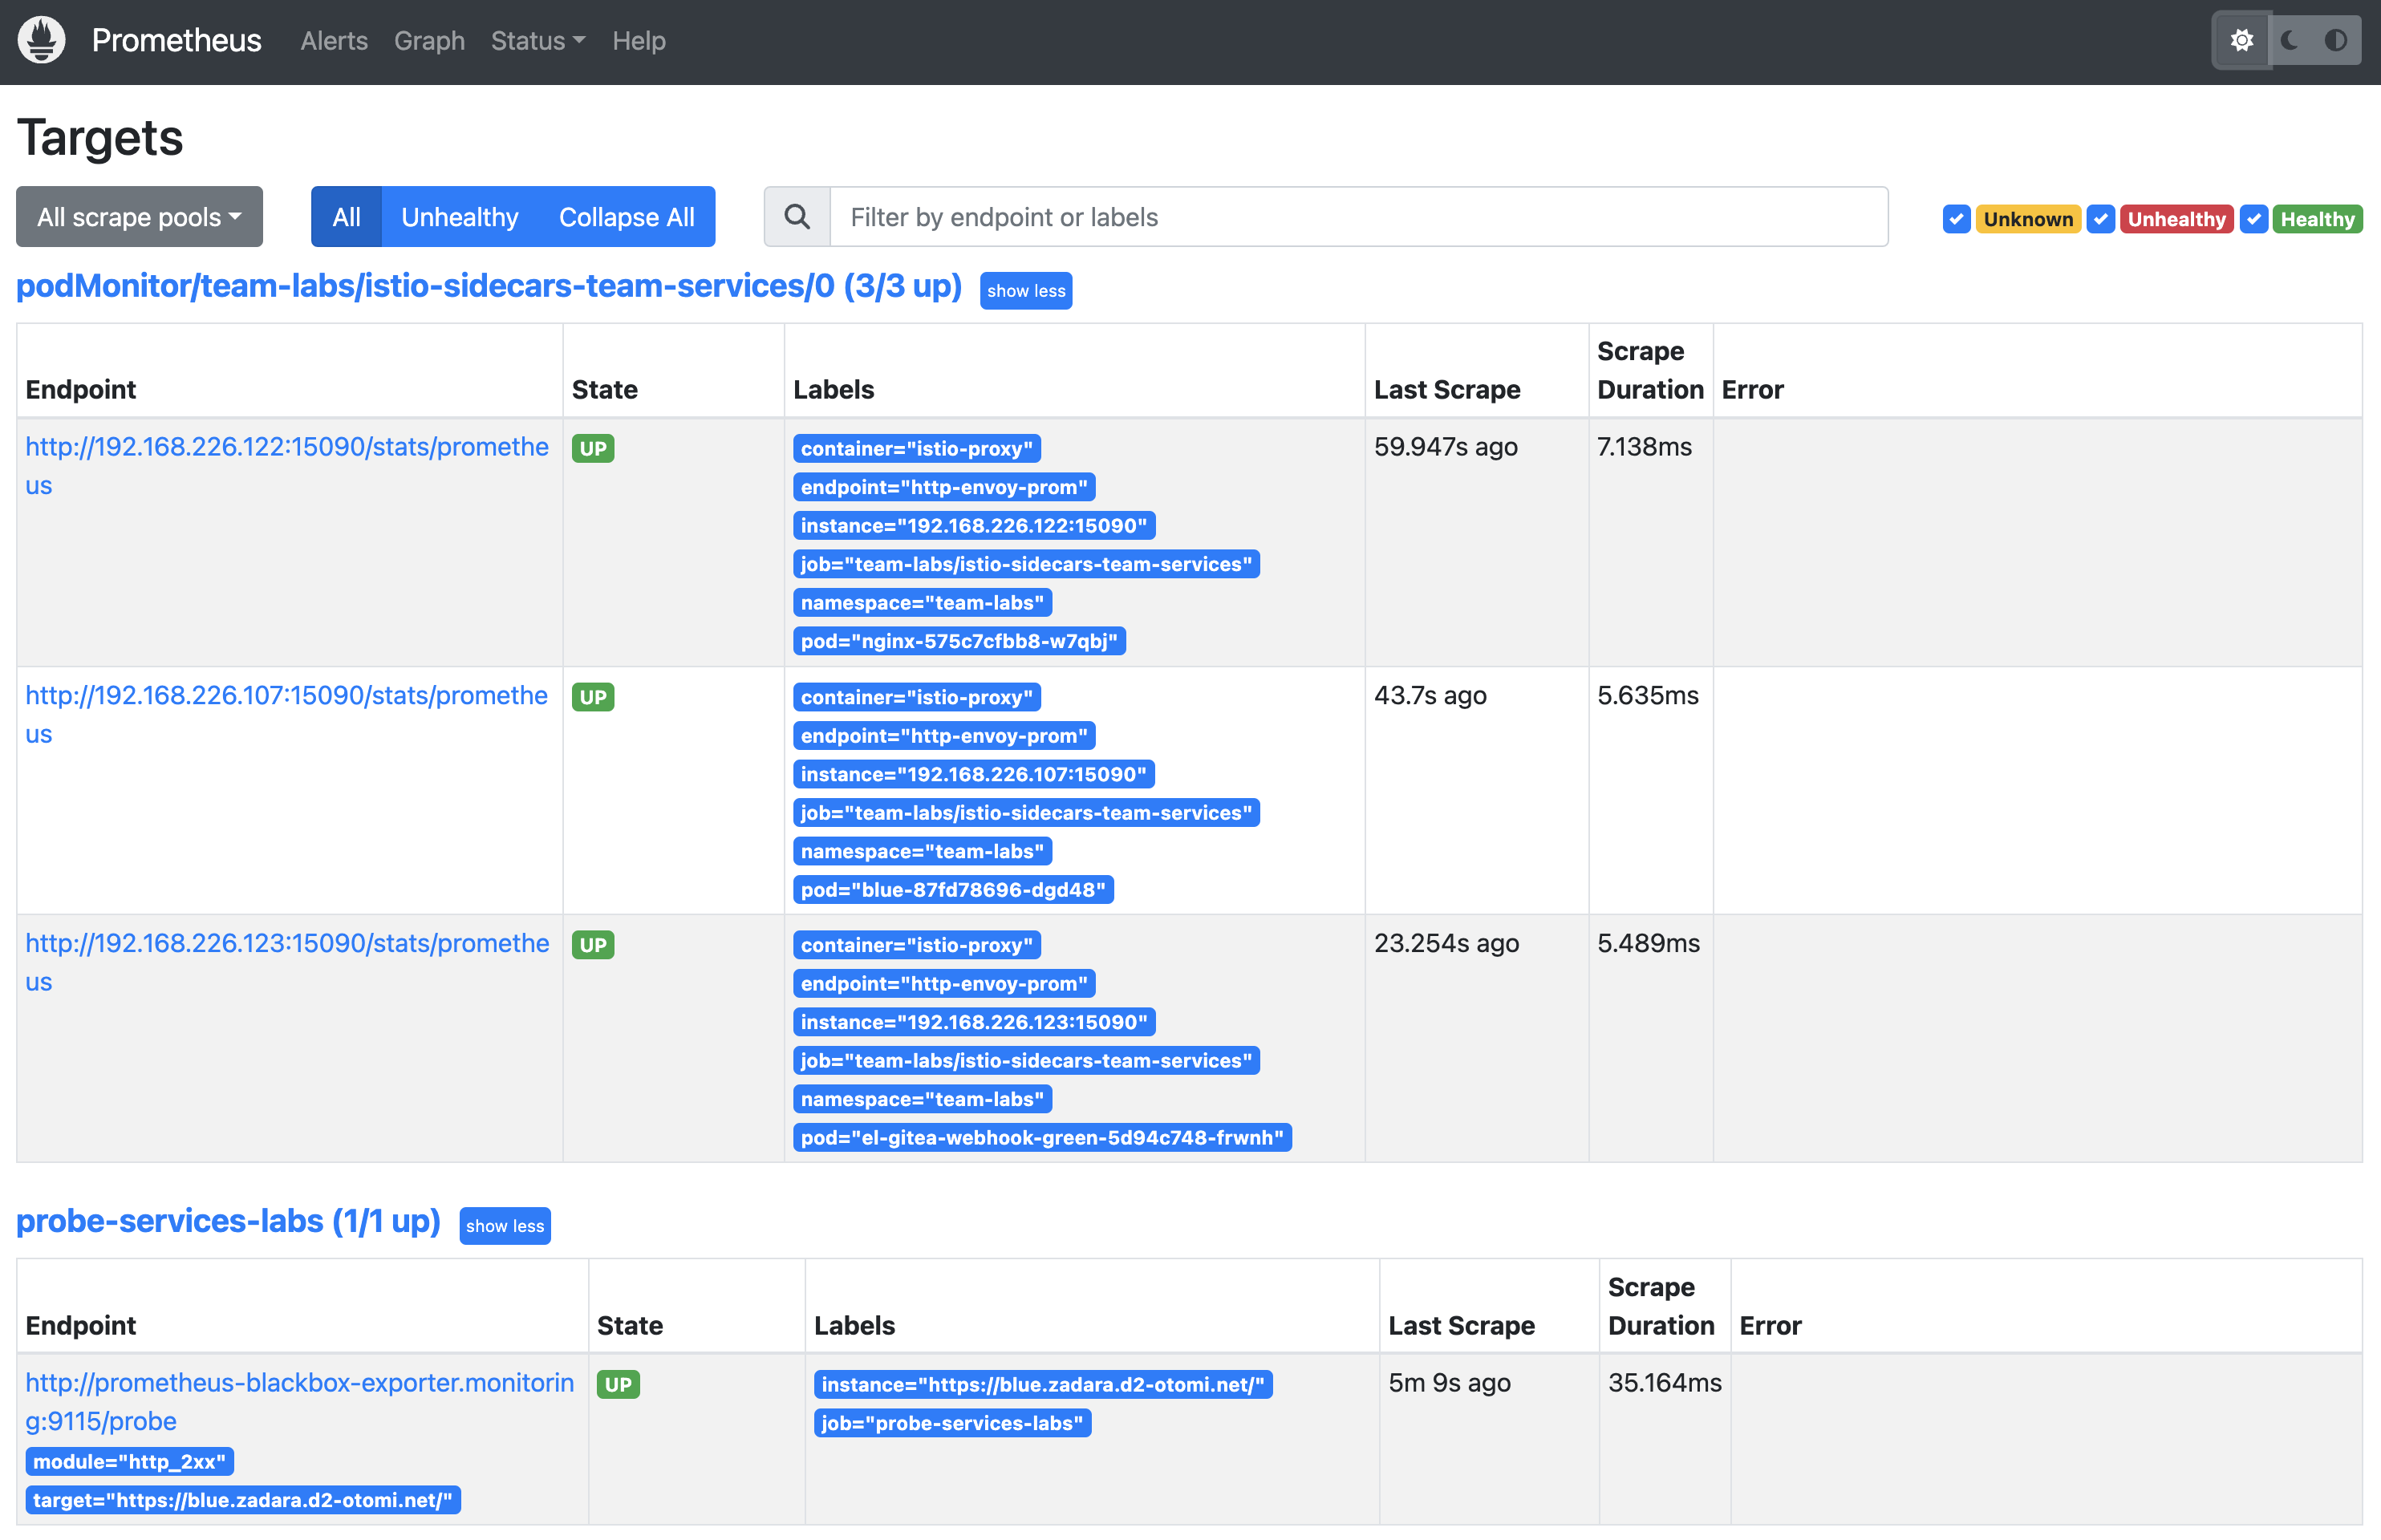
In the list of targets you will see:
- The
PodMonitorendpoints of theistio sidecarsos the Team Workloads - The
Probesof all the Team services that are exposed
- In Prometheus, Go to
Alerts
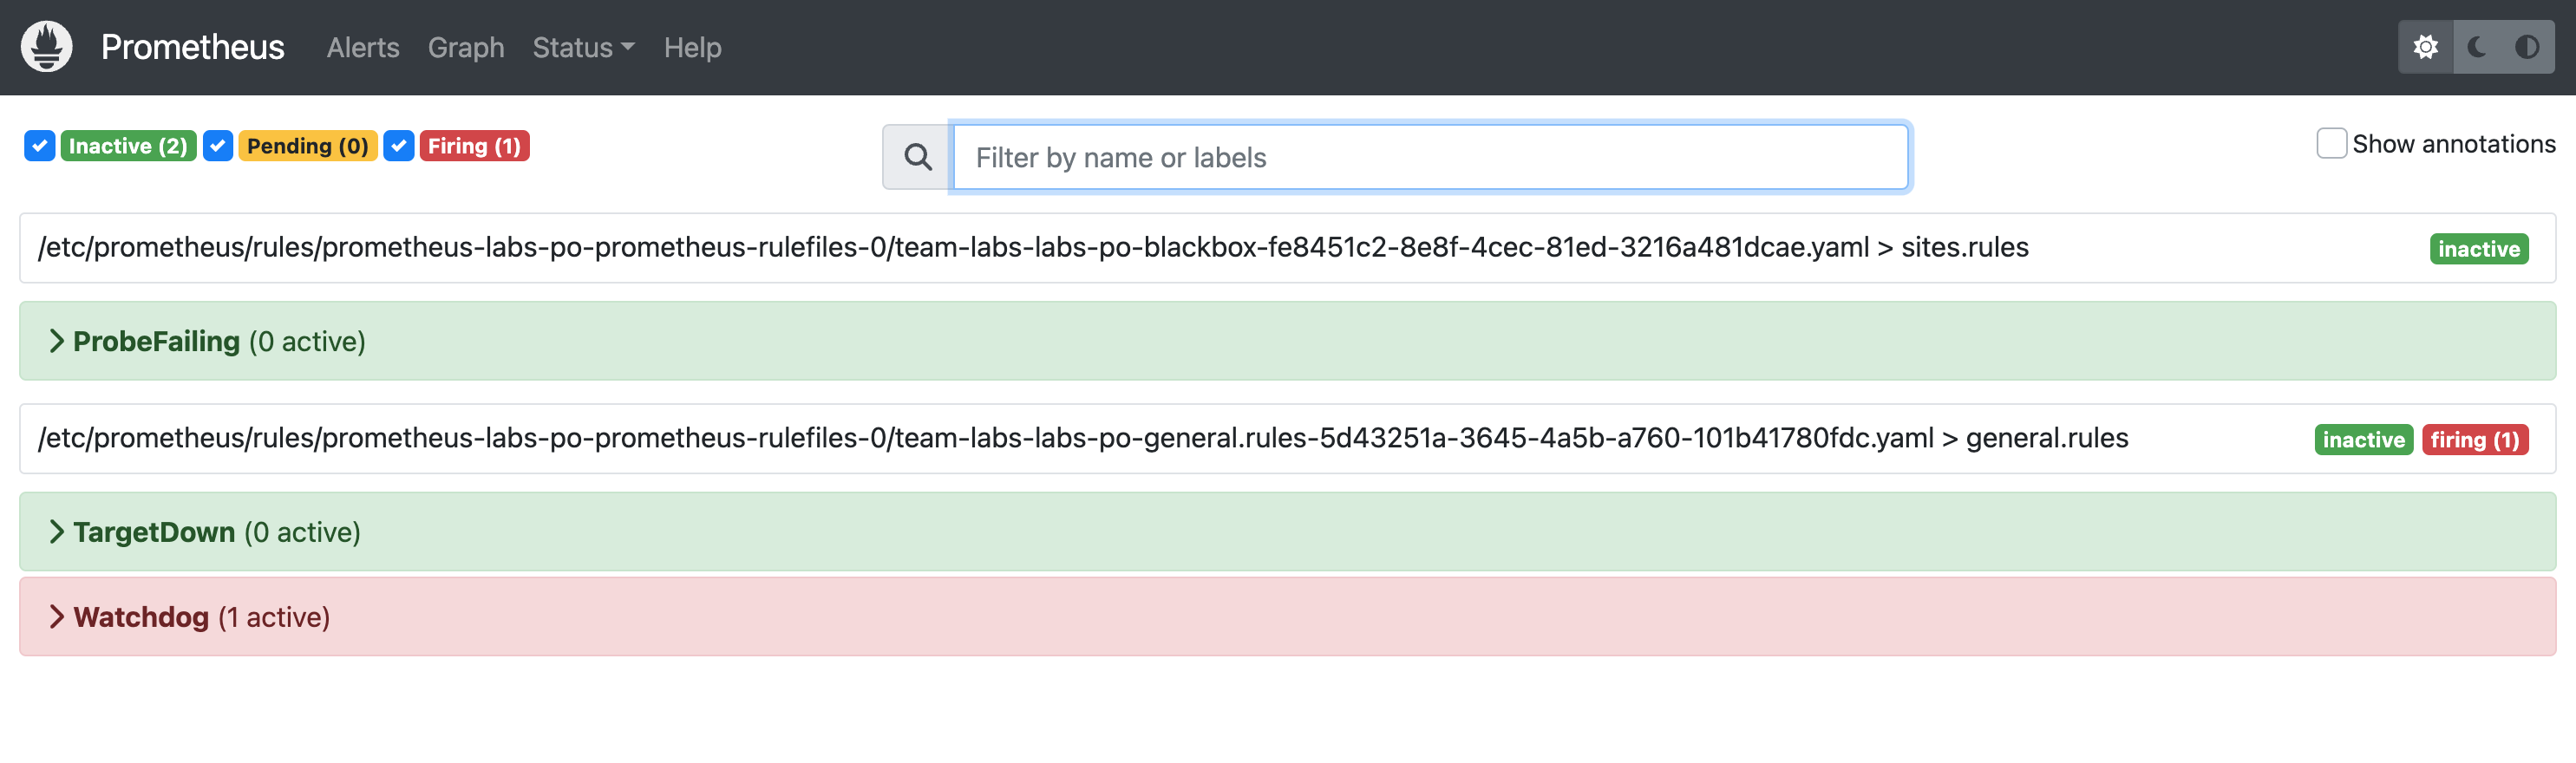
In the alerts you will see an (inactive) alert for ProbeFailing. If the State of a Servive Probe is Down the Prometheus Rule for this alert will fire. When alertmanager is enabled, and an alert notification receiver is configured, you will automatically receive an alert when your exposed Service is down.